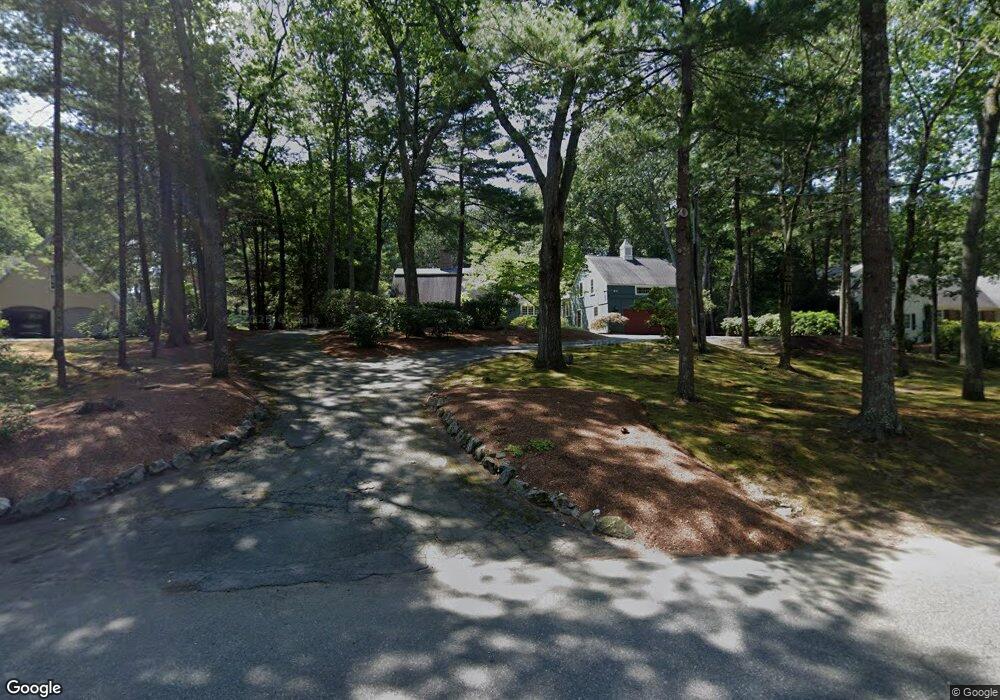
13 Morgan St Wenham, MA 01984
Estimated Value: $1,383,150 - $1,473,000
3
Beds
3
Baths
3,767
Sq Ft
$380/Sq Ft
Est. Value
About This Home
This home is located at 13 Morgan St, Wenham, MA 01984 and is currently estimated at $1,431,717, approximately $380 per square foot. 13 Morgan St is a home located in Essex County with nearby schools including Winthrop School, Bessie Buker Elementary School, and Cutler Elementary School.
Ownership History
Date
Name
Owned For
Owner Type
Purchase Details
Closed on
Feb 6, 2015
Sold by
Walles Robert A and Walles Jennifer
Bought by
Walles Robert A and Walles Jennifer
Current Estimated Value
Purchase Details
Closed on
Aug 30, 2000
Sold by
Mengel Mark B and Frankenstein Laura B
Bought by
Walles Robert A and Fox Jennifer E
Purchase Details
Closed on
Jul 15, 1993
Sold by
Cerretani Craig S and Cerretani Deborah
Bought by
Mengel Mark B and Frankenstein Laura
Purchase Details
Closed on
Oct 16, 1990
Sold by
Macdonald Nathaniel A
Bought by
Cerretani Craig S
Create a Home Valuation Report for This Property
The Home Valuation Report is an in-depth analysis detailing your home's value as well as a comparison with similar homes in the area
Home Values in the Area
Average Home Value in this Area
Purchase History
| Date | Buyer | Sale Price | Title Company |
|---|---|---|---|
| Walles Robert A | -- | -- | |
| Walles Robert A | -- | -- | |
| Walles Robert A | $629,000 | -- | |
| Walles Robert A | $629,000 | -- | |
| Mengel Mark B | $420,000 | -- | |
| Mengel Mark B | $420,000 | -- | |
| Cerretani Craig S | $352,500 | -- |
Source: Public Records
Mortgage History
| Date | Status | Borrower | Loan Amount |
|---|---|---|---|
| Previous Owner | Cerretani Craig S | $417,000 | |
| Previous Owner | Cerretani Craig S | $413,000 |
Source: Public Records
Tax History
| Year | Tax Paid | Tax Assessment Tax Assessment Total Assessment is a certain percentage of the fair market value that is determined by local assessors to be the total taxable value of land and additions on the property. | Land | Improvement |
|---|---|---|---|---|
| 2025 | $16,981 | $1,092,700 | $515,100 | $577,600 |
| 2024 | $16,584 | $1,059,000 | $515,100 | $543,900 |
| 2023 | $16,666 | $960,600 | $562,300 | $398,300 |
| 2022 | $17,904 | $914,400 | $520,800 | $393,600 |
| 2021 | $17,224 | $875,200 | $481,600 | $393,600 |
| 2020 | $16,194 | $855,000 | $481,600 | $373,400 |
| 2019 | $15,407 | $855,000 | $481,600 | $373,400 |
| 2018 | $13,104 | $697,400 | $406,100 | $291,300 |
| 2017 | $12,783 | $697,400 | $406,100 | $291,300 |
| 2016 | $11,842 | $697,400 | $406,100 | $291,300 |
| 2015 | $11,333 | $697,400 | $406,100 | $291,300 |
Source: Public Records
Map
Nearby Homes