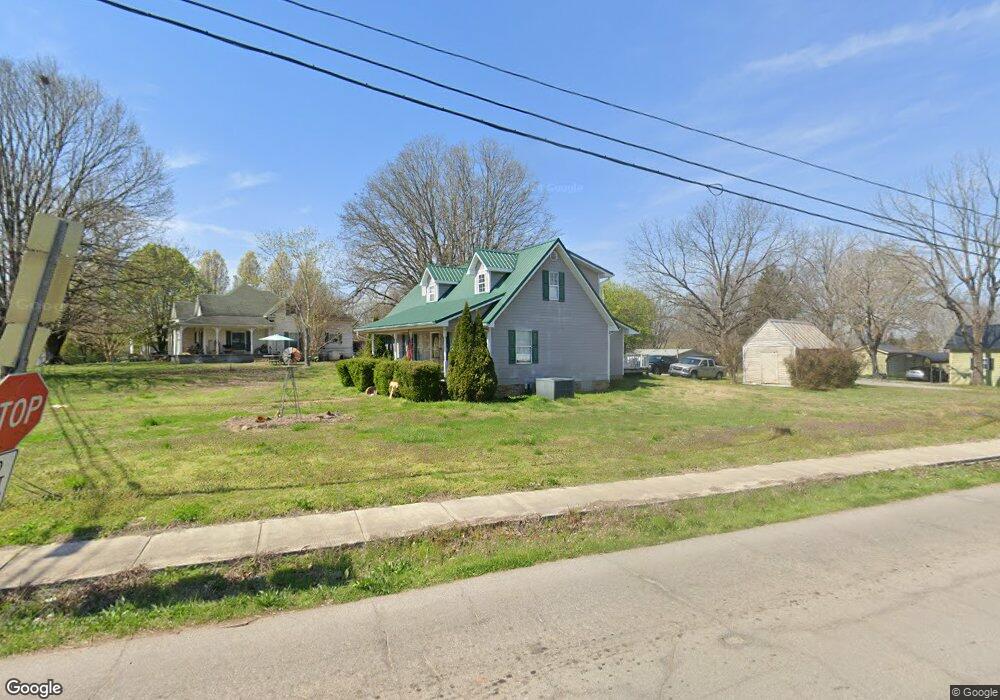
13 N Niota Rd Englewood, TN 37329
Estimated Value: $258,000 - $300,000
3
Beds
4
Baths
1,824
Sq Ft
$151/Sq Ft
Est. Value
About This Home
This home is located at 13 N Niota Rd, Englewood, TN 37329 and is currently estimated at $275,554, approximately $151 per square foot. 13 N Niota Rd is a home located in McMinn County.
Ownership History
Date
Name
Owned For
Owner Type
Purchase Details
Closed on
May 11, 2018
Sold by
Manning Brenda J
Bought by
Burris Christopher
Current Estimated Value
Purchase Details
Closed on
Jan 26, 2015
Sold by
Reed Cecil L
Bought by
Manning Brenda J and Manning Mark A
Purchase Details
Closed on
Aug 24, 2001
Sold by
Reed Cecil L and Reed Barbara C
Bought by
Reed Cecil L and Reed Barbara C
Purchase Details
Closed on
Jul 14, 1995
Bought by
Reed Cecill and Reed Barbara C
Create a Home Valuation Report for This Property
The Home Valuation Report is an in-depth analysis detailing your home's value as well as a comparison with similar homes in the area
Home Values in the Area
Average Home Value in this Area
Purchase History
| Date | Buyer | Sale Price | Title Company |
|---|---|---|---|
| Burris Christopher | $150,000 | -- | |
| Manning Brenda J | $132,000 | -- | |
| Reed Cecil L | -- | -- | |
| Reed Cecill | $5,500 | -- |
Source: Public Records
Tax History Compared to Growth
Tax History
| Year | Tax Paid | Tax Assessment Tax Assessment Total Assessment is a certain percentage of the fair market value that is determined by local assessors to be the total taxable value of land and additions on the property. | Land | Improvement |
|---|---|---|---|---|
| 2025 | $1,098 | $58,325 | $0 | $0 |
| 2024 | $1,098 | $58,325 | $3,500 | $54,825 |
| 2023 | $1,098 | $58,325 | $3,500 | $54,825 |
| 2022 | $1,061 | $37,025 | $2,825 | $34,200 |
| 2021 | $1,061 | $37,025 | $2,825 | $34,200 |
| 2020 | $1,063 | $37,025 | $2,825 | $34,200 |
| 2019 | $1,063 | $37,125 | $2,825 | $34,300 |
| 2018 | $1,063 | $37,125 | $2,825 | $34,300 |
| 2017 | $967 | $31,650 | $2,250 | $29,400 |
| 2016 | $967 | $31,650 | $2,250 | $29,400 |
| 2015 | -- | $31,650 | $2,250 | $29,400 |
| 2014 | $967 | $31,653 | $0 | $0 |
Source: Public Records
Map
Nearby Homes
- 0 Highway 39e Unit 1311542
- 1982 Tennessee 39
- 121 N Niota Rd
- 0 Boyd St
- 309 Englewood Ave
- 302 Locust St
- 111 Sunset Ave
- 118 Sunset Ave
- 110 Old Englewood Rd
- 25 Pangle St
- 302 N Amhurst Place
- 313 N Amhurst Place
- 413 Dodson Ave
- 224 Pond St
- 0 S Amhurst Place Unit 1273764
- 19 Mckinney St
- 504 N Niota Rd
- 520 Chestuee St
- 852 County Road 422
- 3242 U S 411
- 15 W Athens St
- 0 N Niota Rd
- 15 N Niota Rd
- 13 E Athens St
- 19 W Athens St
- 19 Athens Pike-500 502 Pike
- 19 N Niota Rd
- 18 Hamilton St
- Lot 18 Meadow Lawn Dr
- 17 E Athens St
- 23 W Athens St
- 16 N Niota Rd
- 23 E Athens St
- 24 N Niota Rd
- 26 Hamilton St
- 27 E Athens St
- 28 W Athens St
- 23E E Athens St
- 0 Church St
- 30 Hamilton St