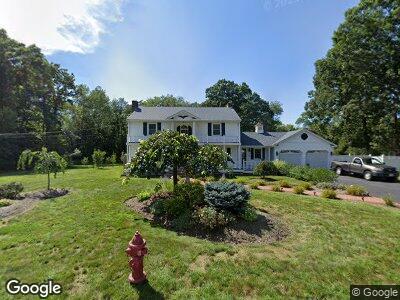
13 Oak Terrace W Bellingham, MA 02019
Estimated Value: $579,946 - $692,000
4
Beds
2
Baths
2,634
Sq Ft
$245/Sq Ft
Est. Value
About This Home
This home is located at 13 Oak Terrace W, Bellingham, MA 02019 and is currently estimated at $646,237, approximately $245 per square foot. 13 Oak Terrace W is a home located in Norfolk County with nearby schools including Joseph F. DiPietro Elementary, Bellingham High School, and Rise Prep Mayoral Academy Middle School.
Ownership History
Date
Name
Owned For
Owner Type
Purchase Details
Closed on
Jan 18, 2022
Sold by
Khoury Antoine H
Bought by
Khoury 3 Rt and Khoury
Current Estimated Value
Purchase Details
Closed on
Dec 10, 2021
Sold by
Khoury 2 Rt and Khoury
Bought by
Khoury Antoine H
Purchase Details
Closed on
Jul 27, 2015
Sold by
Khoury Antoine H
Bought by
Khoury 2 Rt and Khoury
Create a Home Valuation Report for This Property
The Home Valuation Report is an in-depth analysis detailing your home's value as well as a comparison with similar homes in the area
Home Values in the Area
Average Home Value in this Area
Purchase History
| Date | Buyer | Sale Price | Title Company |
|---|---|---|---|
| Khoury 3 Rt | -- | None Available | |
| Khoury Antoine H | -- | None Available | |
| Khoury 2 Rt | -- | -- |
Source: Public Records
Mortgage History
| Date | Status | Borrower | Loan Amount |
|---|---|---|---|
| Previous Owner | Khoury 2Nd Rt | $307,000 | |
| Previous Owner | Khoury Antoine H | $318,000 | |
| Previous Owner | Khoury Antoine H | $245,000 | |
| Previous Owner | Khoury Antoine H | $50,000 | |
| Previous Owner | Khoury Antoine H | $90,000 |
Source: Public Records
Tax History Compared to Growth
Tax History
| Year | Tax Paid | Tax Assessment Tax Assessment Total Assessment is a certain percentage of the fair market value that is determined by local assessors to be the total taxable value of land and additions on the property. | Land | Improvement |
|---|---|---|---|---|
| 2025 | $6,624 | $527,400 | $170,900 | $356,500 |
| 2024 | $6,390 | $496,900 | $156,100 | $340,800 |
| 2023 | $6,157 | $471,800 | $148,600 | $323,200 |
| 2022 | $5,670 | $402,700 | $123,900 | $278,800 |
| 2021 | $5,479 | $380,200 | $123,900 | $256,300 |
| 2020 | $5,291 | $372,100 | $123,900 | $248,200 |
| 2019 | $5,199 | $365,900 | $123,900 | $242,000 |
| 2018 | $5,038 | $349,600 | $119,200 | $230,400 |
| 2017 | $4,919 | $343,000 | $119,200 | $223,800 |
| 2016 | $4,693 | $328,400 | $117,200 | $211,200 |
| 2015 | $4,446 | $312,000 | $112,700 | $199,300 |
| 2014 | $4,484 | $305,900 | $110,100 | $195,800 |
Source: Public Records
Map
Nearby Homes
- 3 Dorena St
- 8 Bliss Rd
- 702 Rathbun St
- 1 Taft Dr
- 4 Diana St
- 101 Pine Grove Ave
- 0 Central Blvd
- 21 Trenton St
- Lot 2 Pulaski Blvd
- 111 Harris Pond Rd
- 150 Garden St
- 452 S Main St
- 79 Dewey St
- 26 Lakeview St
- 20 Fox Run Rd Unit 20
- 40 Valley St
- 194 Paine St
- 120 Mill St Unit 104
- 112 Mill St Unit 102
- 127 St Agnes Ave