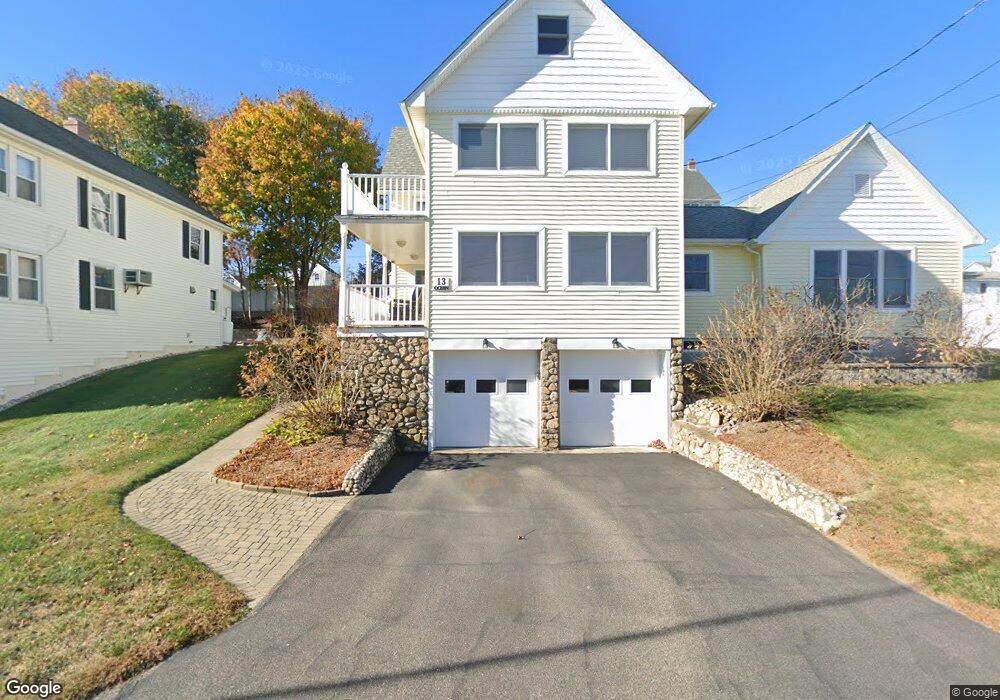
13 Ocean Ave Niantic, CT 06357
Niantic NeighborhoodEstimated Value: $670,000 - $1,005,000
4
Beds
4
Baths
2,414
Sq Ft
$353/Sq Ft
Est. Value
About This Home
This home is located at 13 Ocean Ave, Niantic, CT 06357 and is currently estimated at $851,198, approximately $352 per square foot. 13 Ocean Ave is a home located in New London County with nearby schools including East Lyme Middle School, East Lyme High School, and The Light House Voc-Ed Center.
Ownership History
Date
Name
Owned For
Owner Type
Purchase Details
Closed on
Jan 5, 1996
Sold by
Lawton Mildred I Est
Bought by
Schmidt William R and Schmidt Janet L
Current Estimated Value
Home Financials for this Owner
Home Financials are based on the most recent Mortgage that was taken out on this home.
Original Mortgage
$193,000
Interest Rate
7.34%
Mortgage Type
Unknown
Create a Home Valuation Report for This Property
The Home Valuation Report is an in-depth analysis detailing your home's value as well as a comparison with similar homes in the area
Home Values in the Area
Average Home Value in this Area
Purchase History
| Date | Buyer | Sale Price | Title Company |
|---|---|---|---|
| Schmidt William R | $145,000 | -- |
Source: Public Records
Mortgage History
| Date | Status | Borrower | Loan Amount |
|---|---|---|---|
| Open | Schmidt William R | $150,000 | |
| Closed | Schmidt William R | $87,500 | |
| Closed | Schmidt William R | $193,000 |
Source: Public Records
Tax History
| Year | Tax Paid | Tax Assessment Tax Assessment Total Assessment is a certain percentage of the fair market value that is determined by local assessors to be the total taxable value of land and additions on the property. | Land | Improvement |
|---|---|---|---|---|
| 2025 | $11,394 | $406,770 | $213,290 | $193,480 |
| 2024 | $10,718 | $406,770 | $213,290 | $193,480 |
| 2023 | $10,120 | $406,770 | $213,290 | $193,480 |
| 2022 | $9,697 | $406,770 | $213,290 | $193,480 |
| 2021 | $9,280 | $325,500 | $203,560 | $121,940 |
| 2020 | $9,231 | $325,500 | $203,560 | $121,940 |
| 2019 | $9,176 | $325,500 | $203,560 | $121,940 |
| 2018 | $8,902 | $325,500 | $203,560 | $121,940 |
| 2017 | $8,515 | $325,500 | $203,560 | $121,940 |
| 2016 | $9,648 | $380,450 | $252,070 | $128,380 |
| 2015 | $9,401 | $380,450 | $252,070 | $128,380 |
| 2014 | $9,142 | $380,450 | $252,070 | $128,380 |
Source: Public Records
Map
Nearby Homes
- 42 S Washington Ave
- 468 Main St Unit 318
- 468 Main St Unit 111
- 43 Village Crossing Unit 43
- 127 Black Point Rd Unit 7
- 47 Village Crossing Unit 47
- 46 Village Crossing Unit 46
- 36 Attawan Rd
- 26 Mohawk Dr
- 185 Main St Unit 301
- 185 Main St Unit 305
- 97 W Main St Unit 36
- 19 Sapia Dr
- 37 Stoneywood Dr
- 12 Spinnaker Dr
- 61 Whitecap Rd
- 47 Oswegatchie Hills Rd
- 43 Roxbury Ct
- 55 Corey Ln
- 31 Regatta Dr
Your Personal Tour Guide
Ask me questions while you tour the home.