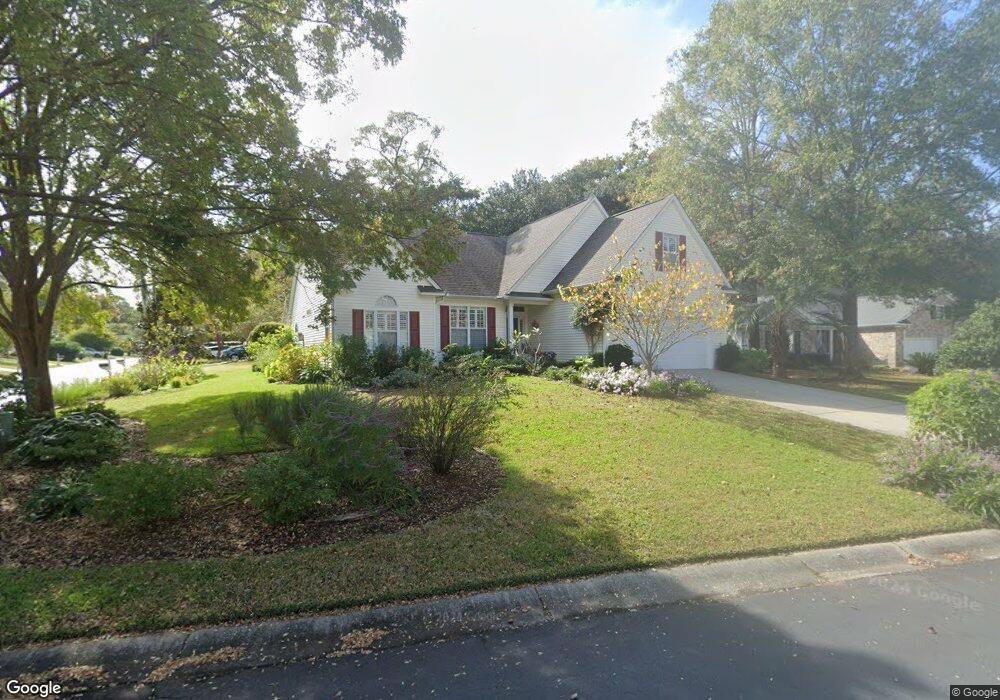
13 Pierpont Ct Unit The Tradition Pawleys Island, SC 29585
Estimated Value: $546,000 - $637,000
3
Beds
2
Baths
2,417
Sq Ft
$239/Sq Ft
Est. Value
About This Home
This home is located at 13 Pierpont Ct Unit The Tradition, Pawleys Island, SC 29585 and is currently estimated at $576,567, approximately $238 per square foot. 13 Pierpont Ct Unit The Tradition is a home located in Georgetown County with nearby schools including Waccamaw Elementary School, Waccamaw Intermediate School, and Waccamaw Middle School.
Ownership History
Date
Name
Owned For
Owner Type
Purchase Details
Closed on
Apr 29, 2015
Sold by
Emmick James C and Emmick Sharon P
Bought by
Wilder John D and Wilder Mary K
Current Estimated Value
Home Financials for this Owner
Home Financials are based on the most recent Mortgage that was taken out on this home.
Original Mortgage
$204,000
Outstanding Balance
$158,230
Interest Rate
3.87%
Mortgage Type
New Conventional
Estimated Equity
$418,337
Purchase Details
Closed on
Jul 28, 2011
Sold by
Gabriel Lawrence E and Gabriel Kathleen M
Bought by
Emmick James C and Emmick Sharon P
Purchase Details
Closed on
Jun 30, 2008
Sold by
Jacobucci Thomas J and Jacobucci Finola M
Bought by
Gabriel Lawrence E and Gabriel Kathleen M
Purchase Details
Closed on
Mar 24, 2004
Sold by
Jacobucci Thomas J
Bought by
Jacobucci Thomas J and Jacobucci Finola M
Purchase Details
Closed on
Sep 28, 1999
Sold by
Centex Homes
Bought by
Jacobucci Thomas J and Jacobucci Tiona R
Create a Home Valuation Report for This Property
The Home Valuation Report is an in-depth analysis detailing your home's value as well as a comparison with similar homes in the area
Home Values in the Area
Average Home Value in this Area
Purchase History
| Date | Buyer | Sale Price | Title Company |
|---|---|---|---|
| Wilder John D | $255,000 | -- | |
| Emmick James C | $255,000 | -- | |
| Gabriel Lawrence E | $280,000 | -- | |
| Jacobucci Thomas J | -- | -- | |
| Jacobucci Thomas J | $164,688 | -- |
Source: Public Records
Mortgage History
| Date | Status | Borrower | Loan Amount |
|---|---|---|---|
| Open | Wilder John D | $204,000 |
Source: Public Records
Tax History Compared to Growth
Tax History
| Year | Tax Paid | Tax Assessment Tax Assessment Total Assessment is a certain percentage of the fair market value that is determined by local assessors to be the total taxable value of land and additions on the property. | Land | Improvement |
|---|---|---|---|---|
| 2024 | $1,611 | $12,126 | $2,786 | $9,340 |
| 2023 | $1,611 | $12,126 | $2,786 | $9,340 |
| 2022 | $1,483 | $12,126 | $2,786 | $9,340 |
| 2021 | $1,437 | $12,126 | $2,786 | $9,340 |
| 2020 | $1,433 | $13,928 | $3,200 | $10,728 |
| 2019 | $1,247 | $10,544 | $2,800 | $7,744 |
| 2018 | $1,275 | $105,440 | $0 | $0 |
| 2017 | $1,091 | $105,440 | $0 | $0 |
| 2016 | $1,005 | $9,832 | $0 | $0 |
| 2015 | -- | $0 | $0 | $0 |
| 2014 | -- | $253,600 | $70,000 | $183,600 |
| 2012 | -- | $253,600 | $70,000 | $183,600 |
Source: Public Records
Map
Nearby Homes
- 23 Revolution Ct Unit Access to Litchfield
- 1692 Tradition Club Dr
- 1131 Tradition Club Dr
- 383 Oatland Lake Rd
- 1120 Crooked Oak Dr
- 356 Chapman Loop
- 423 Chapman Loop
- 1464 Hawthorn Dr Unit LCC 16
- 1259 Oatland Lake Rd
- 219 Vintage Dr
- 311 Parkview Dr
- 1495 Hawthorn Dr
- 118 Oatland Lake Rd
- 509 Heston Point Dr
- 118 Goodson Loop Unit Lot 5 Litchfield Cou
- 115 Coleman Ct
- 346 Tuckers Rd Unit A
- 44 Hamby Dr
- 77 Tern Place Unit 202
- 695 Country Club Dr Unit POND / GOLF FRONTAGE
- 13 Pierpont Ct
- 27 Pierpont Ct
- 1492 Tradition Club Dr
- 12 Pierpont Ct
- 1475 Tradition Club Dr
- 1506 Tradition Club Dr
- 1493 Tradition Club Dr
- 24 Pierpont Ct
- 1453 Tradition Club Dr
- 41 Pierpont Ct
- 1509 Tradition Club Dr
- 1509 Tradition Club Dr Unit Tradition
- 38 Pierpont Ct
- 1438 Tradition Club Dr
- 48 Pierpont Ct
- 1431 Tradition Club Dr
- 23 Revolution Ct
- 1525 Tradition Club Dr
- 29 Revolution Ct
- 1422 Tradition Club Dr