13 Pine Ave Unit 1 Brockton, MA 02302
Clifton Heights NeighborhoodEstimated Value: $556,448 - $589,000
4
Beds
2
Baths
1,836
Sq Ft
$314/Sq Ft
Est. Value
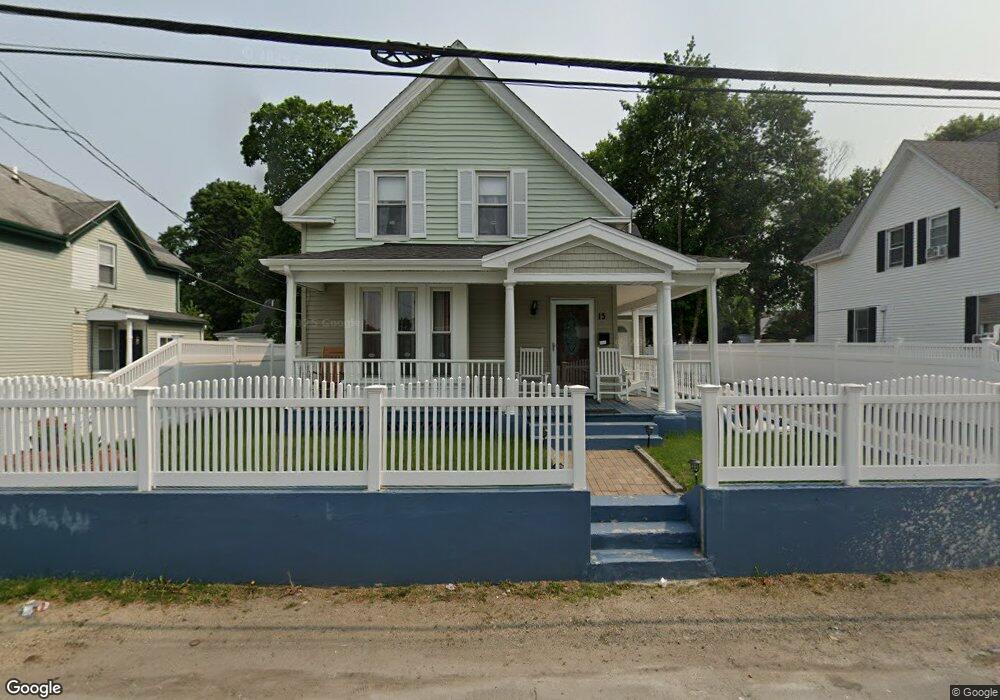
About This Home
This home is located at 13 Pine Ave Unit 1, Brockton, MA 02302 and is currently estimated at $576,112, approximately $313 per square foot. 13 Pine Ave Unit 1 is a home located in Plymouth County with nearby schools including John F. Kennedy Elementary School, Davis K-8 School, and South Middle School.
Ownership History
Date
Name
Owned For
Owner Type
Purchase Details
Closed on
Apr 25, 2016
Sold by
Veiga Manuel C
Bought by
Vilnaigre-Francois E and Vilnaigre Necasty
Current Estimated Value
Home Financials for this Owner
Home Financials are based on the most recent Mortgage that was taken out on this home.
Original Mortgage
$260,200
Outstanding Balance
$206,051
Interest Rate
3.5%
Mortgage Type
FHA
Estimated Equity
$370,061
Purchase Details
Closed on
Feb 20, 1998
Sold by
Bent Daniel C and Citizens Bk Of Ma
Bought by
Citizens Bk Of Ma
Create a Home Valuation Report for This Property
The Home Valuation Report is an in-depth analysis detailing your home's value as well as a comparison with similar homes in the area
Home Values in the Area
Average Home Value in this Area
Purchase History
| Date | Buyer | Sale Price | Title Company |
|---|---|---|---|
| Vilnaigre-Francois E | $265,000 | -- | |
| Citizens Bk Of Ma | $55,000 | -- |
Source: Public Records
Mortgage History
| Date | Status | Borrower | Loan Amount |
|---|---|---|---|
| Open | Vilnaigre-Francois E | $260,200 | |
| Previous Owner | Citizens Bk Of Ma | $155,677 | |
| Previous Owner | Citizens Bk Of Ma | $115,710 | |
| Previous Owner | Citizens Bk Of Ma | $75,000 |
Source: Public Records
Tax History Compared to Growth
Tax History
| Year | Tax Paid | Tax Assessment Tax Assessment Total Assessment is a certain percentage of the fair market value that is determined by local assessors to be the total taxable value of land and additions on the property. | Land | Improvement |
|---|---|---|---|---|
| 2025 | $5,919 | $488,800 | $140,200 | $348,600 |
| 2024 | $5,654 | $470,400 | $140,200 | $330,200 |
| 2023 | $4,897 | $377,300 | $105,100 | $272,200 |
| 2022 | $5,070 | $362,900 | $95,500 | $267,400 |
| 2021 | $4,782 | $329,800 | $79,500 | $250,300 |
| 2020 | $4,121 | $272,000 | $74,300 | $197,700 |
| 2019 | $4,260 | $274,100 | $72,400 | $201,700 |
| 2018 | $3,837 | $250,000 | $72,400 | $177,600 |
| 2017 | $3,800 | $236,000 | $72,400 | $163,600 |
| 2016 | $3,545 | $204,200 | $70,300 | $133,900 |
| 2015 | $2,835 | $156,200 | $70,300 | $85,900 |
| 2014 | $2,972 | $163,900 | $70,300 | $93,600 |
Source: Public Records
Map
Nearby Homes