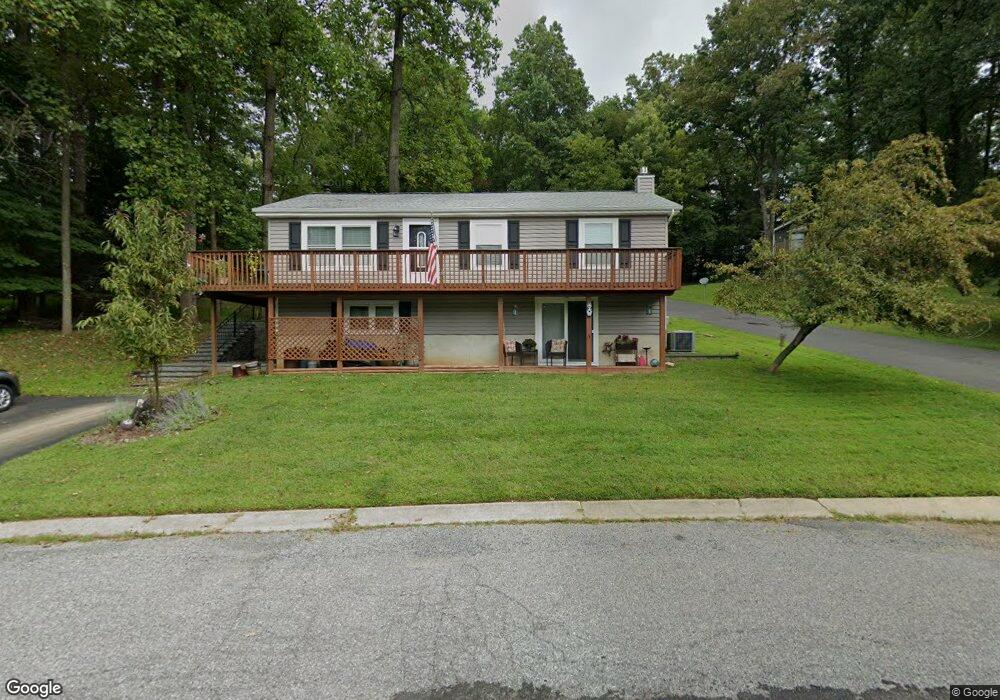
13 Pleasant Rd High Bridge, NJ 08829
Estimated Value: $295,000 - $384,000
--
Bed
--
Bath
1,040
Sq Ft
$331/Sq Ft
Est. Value
About This Home
This home is located at 13 Pleasant Rd, High Bridge, NJ 08829 and is currently estimated at $344,345, approximately $331 per square foot. 13 Pleasant Rd is a home located in Hunterdon County with nearby schools including High Bridge Elementary School, High Bridge Middle School, and Voorhees High School.
Ownership History
Date
Name
Owned For
Owner Type
Purchase Details
Closed on
Jul 22, 1998
Sold by
Zuluaga John A
Bought by
Elsasser Eric J and Elsasser Patricia M
Current Estimated Value
Home Financials for this Owner
Home Financials are based on the most recent Mortgage that was taken out on this home.
Original Mortgage
$128,000
Interest Rate
6.7%
Purchase Details
Closed on
Apr 10, 1997
Sold by
Diamond Irwin S
Bought by
Zuluaga John A and Zuluaga Tracy A
Home Financials for this Owner
Home Financials are based on the most recent Mortgage that was taken out on this home.
Original Mortgage
$124,000
Interest Rate
7.55%
Mortgage Type
VA
Create a Home Valuation Report for This Property
The Home Valuation Report is an in-depth analysis detailing your home's value as well as a comparison with similar homes in the area
Home Values in the Area
Average Home Value in this Area
Purchase History
| Date | Buyer | Sale Price | Title Company |
|---|---|---|---|
| Elsasser Eric J | $132,000 | -- | |
| Zuluaga John A | $121,500 | -- |
Source: Public Records
Mortgage History
| Date | Status | Borrower | Loan Amount |
|---|---|---|---|
| Previous Owner | Elsasser Eric J | $128,000 | |
| Previous Owner | Zuluaga John A | $124,000 |
Source: Public Records
Tax History Compared to Growth
Tax History
| Year | Tax Paid | Tax Assessment Tax Assessment Total Assessment is a certain percentage of the fair market value that is determined by local assessors to be the total taxable value of land and additions on the property. | Land | Improvement |
|---|---|---|---|---|
| 2025 | $10,161 | $308,400 | $162,800 | $145,600 |
| 2024 | $8,042 | $311,300 | $93,600 | $217,700 |
| 2023 | $8,042 | $203,400 | $73,800 | $129,600 |
| 2022 | $8,472 | $199,100 | $68,800 | $130,300 |
| 2021 | $8,171 | $199,300 | $68,800 | $130,500 |
| 2020 | $8,208 | $200,200 | $69,000 | $131,200 |
| 2019 | $8,171 | $197,800 | $65,800 | $132,000 |
| 2018 | $7,819 | $197,300 | $64,600 | $132,700 |
| 2017 | $7,816 | $202,800 | $67,800 | $135,000 |
| 2016 | $7,725 | $202,800 | $67,800 | $135,000 |
| 2015 | $7,516 | $202,800 | $67,800 | $135,000 |
| 2014 | $6,899 | $201,200 | $112,200 | $89,000 |
Source: Public Records
Map
Nearby Homes