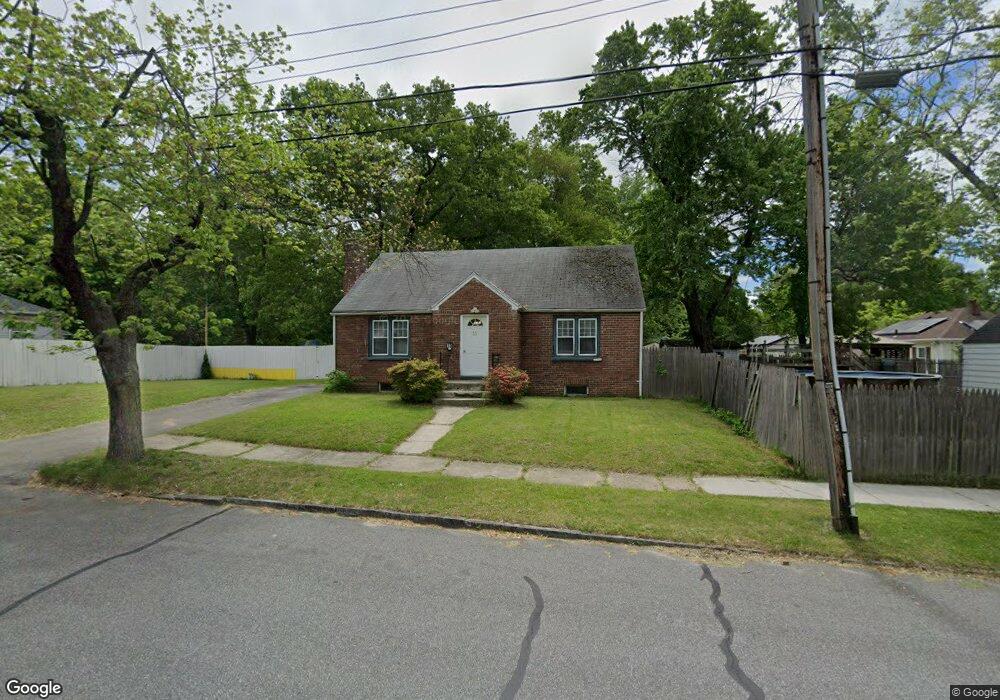
13 Plum St Unit 1 Springfield, MA 01109
Pine Point NeighborhoodEstimated Value: $272,000 - $312,000
4
Beds
1
Bath
1,260
Sq Ft
$235/Sq Ft
Est. Value
About This Home
This home is located at 13 Plum St Unit 1, Springfield, MA 01109 and is currently estimated at $296,551, approximately $235 per square foot. 13 Plum St Unit 1 is a home located in Hampden County with nearby schools including Thomas M Balliet Elementary School, John J Duggan Middle, and Roger L. Putnam Vocational Technical Academy.
Ownership History
Date
Name
Owned For
Owner Type
Purchase Details
Closed on
Jan 31, 2017
Sold by
Bellucci Anthony A
Bought by
Njugna Beth
Current Estimated Value
Home Financials for this Owner
Home Financials are based on the most recent Mortgage that was taken out on this home.
Original Mortgage
$112,891
Outstanding Balance
$93,259
Interest Rate
4.12%
Mortgage Type
FHA
Estimated Equity
$203,292
Purchase Details
Closed on
Dec 28, 2010
Sold by
Bank Of America Na
Bought by
Bellucci Anthony A
Purchase Details
Closed on
Sep 1, 2010
Sold by
White Thomas A
Bought by
Bank Of America Na
Create a Home Valuation Report for This Property
The Home Valuation Report is an in-depth analysis detailing your home's value as well as a comparison with similar homes in the area
Home Values in the Area
Average Home Value in this Area
Purchase History
| Date | Buyer | Sale Price | Title Company |
|---|---|---|---|
| Njugna Beth | $115,000 | -- | |
| Bellucci Anthony A | $34,200 | -- | |
| Bank Of America Na | $53,928 | -- |
Source: Public Records
Mortgage History
| Date | Status | Borrower | Loan Amount |
|---|---|---|---|
| Open | Njugna Beth | $112,891 |
Source: Public Records
Tax History Compared to Growth
Tax History
| Year | Tax Paid | Tax Assessment Tax Assessment Total Assessment is a certain percentage of the fair market value that is determined by local assessors to be the total taxable value of land and additions on the property. | Land | Improvement |
|---|---|---|---|---|
| 2025 | $4,005 | $255,400 | $41,700 | $213,700 |
| 2024 | $3,912 | $243,600 | $34,700 | $208,900 |
| 2023 | $3,754 | $220,200 | $31,600 | $188,600 |
| 2022 | $3,188 | $169,400 | $29,500 | $139,900 |
| 2021 | $2,797 | $148,000 | $26,800 | $121,200 |
| 2020 | $2,639 | $135,100 | $26,800 | $108,300 |
| 2019 | $2,592 | $131,700 | $26,800 | $104,900 |
| 2018 | $2,667 | $135,500 | $26,800 | $108,700 |
| 2017 | $2,656 | $135,100 | $24,800 | $110,300 |
| 2016 | $2,265 | $115,200 | $24,800 | $90,400 |
| 2015 | $2,225 | $113,100 | $24,800 | $88,300 |
Source: Public Records
Map
Nearby Homes