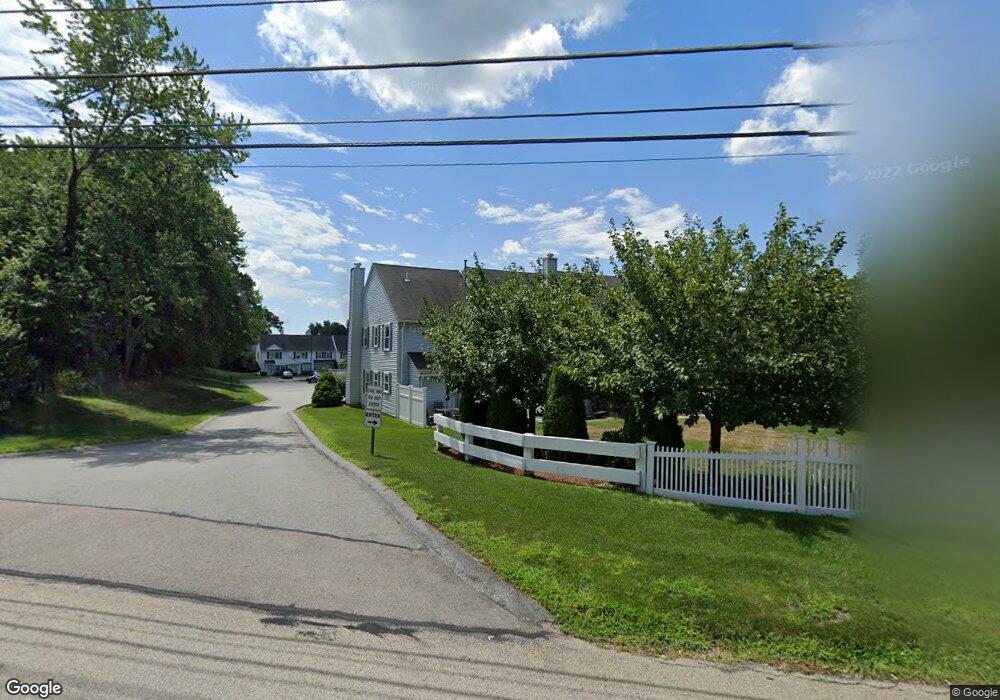
13 Pullard Rd Unit 49 Grafton, MA 01519
Estimated Value: $365,000 - $424,000
2
Beds
3
Baths
1,166
Sq Ft
$332/Sq Ft
Est. Value
About This Home
This home is located at 13 Pullard Rd Unit 49, Grafton, MA 01519 and is currently estimated at $386,982, approximately $331 per square foot. 13 Pullard Rd Unit 49 is a home located in Worcester County with nearby schools including Grafton High School, Silver Spruce Montessori School, and Touchstone Community School.
Ownership History
Date
Name
Owned For
Owner Type
Purchase Details
Closed on
May 29, 2025
Sold by
Daly Kristin E
Bought by
Dorazio Dean
Current Estimated Value
Home Financials for this Owner
Home Financials are based on the most recent Mortgage that was taken out on this home.
Original Mortgage
$159,375
Outstanding Balance
$158,553
Interest Rate
6.83%
Mortgage Type
Purchase Money Mortgage
Estimated Equity
$228,429
Purchase Details
Closed on
Mar 13, 2008
Sold by
Palermo Christine
Bought by
Daly Kristin E
Home Financials for this Owner
Home Financials are based on the most recent Mortgage that was taken out on this home.
Original Mortgage
$207,100
Interest Rate
5.72%
Mortgage Type
Purchase Money Mortgage
Purchase Details
Closed on
Oct 11, 1995
Sold by
Greenstein Joel
Bought by
Palermo Christine
Home Financials for this Owner
Home Financials are based on the most recent Mortgage that was taken out on this home.
Original Mortgage
$45,000
Interest Rate
7.71%
Mortgage Type
Purchase Money Mortgage
Purchase Details
Closed on
Jan 4, 1989
Sold by
Riverview Condo Inc
Bought by
Kelly Peter M
Home Financials for this Owner
Home Financials are based on the most recent Mortgage that was taken out on this home.
Original Mortgage
$104,400
Interest Rate
10.32%
Mortgage Type
Purchase Money Mortgage
Create a Home Valuation Report for This Property
The Home Valuation Report is an in-depth analysis detailing your home's value as well as a comparison with similar homes in the area
Home Values in the Area
Average Home Value in this Area
Purchase History
| Date | Buyer | Sale Price | Title Company |
|---|---|---|---|
| Dorazio Dean | $212,500 | None Available | |
| Dorazio Dean | $212,500 | None Available | |
| Daly Kristin E | $218,000 | -- | |
| Daly Kristin E | $218,000 | -- | |
| Palermo Christine | $55,000 | -- | |
| Palermo Christine | $55,000 | -- | |
| Kelly Peter M | $116,912 | -- |
Source: Public Records
Mortgage History
| Date | Status | Borrower | Loan Amount |
|---|---|---|---|
| Open | Dorazio Dean | $159,375 | |
| Closed | Dorazio Dean | $159,375 | |
| Previous Owner | Daly Kristin E | $207,100 | |
| Previous Owner | Kelly Peter M | $45,000 | |
| Previous Owner | Kelly Peter M | $104,400 |
Source: Public Records
Tax History
| Year | Tax Paid | Tax Assessment Tax Assessment Total Assessment is a certain percentage of the fair market value that is determined by local assessors to be the total taxable value of land and additions on the property. | Land | Improvement |
|---|---|---|---|---|
| 2025 | $4,588 | $329,100 | $0 | $329,100 |
| 2024 | $4,545 | $317,600 | $0 | $317,600 |
| 2023 | $4,361 | $277,600 | $0 | $277,600 |
| 2022 | $4,220 | $250,000 | $0 | $250,000 |
| 2021 | $4,091 | $238,100 | $0 | $238,100 |
| 2020 | $3,952 | $239,500 | $0 | $239,500 |
| 2019 | $3,440 | $206,500 | $0 | $206,500 |
| 2018 | $3,230 | $194,700 | $0 | $194,700 |
| 2017 | $3,103 | $189,200 | $0 | $189,200 |
| 2016 | $2,953 | $176,300 | $0 | $176,300 |
| 2015 | $2,879 | $174,500 | $0 | $174,500 |
| 2014 | $2,663 | $174,500 | $0 | $174,500 |
Source: Public Records
Map
Nearby Homes
- 48 Londonderry Rd
- 51 Londonderry Rd Unit 51
- 268 Magill Dr Unit 268
- 53 Nottingham Rd
- 31 South St
- 63 Providence Rd Unit 2
- 6 Oak St
- 56 Luka Dr Unit 56
- 9 Danielle Dr
- 19 Fitzpatrick Rd
- 75 Potter Hill Rd
- 14 Cortland Way
- 22 Elmwood St
- 9 Logan Path
- 109 Main St
- 64 Fisherville Terrace
- 62 Fisherville Terrace
- 58 Fisherville Terrace
- 44 Fisherville Terrace
- 66 North St
- 13 Pullard Rd Unit 52
- 13 Pullard Rd Unit 51
- 13 Pullard Rd Unit 50
- 13 Pullard Rd Unit 48
- 13 Pullard Rd Unit 47
- 13 Pullard Rd Unit 46
- 13 Pullard Rd Unit 45
- 13 Pullard Rd Unit 44
- 13 Pullard Rd Unit 43
- 13 Pullard Rd Unit 42
- 13 Pullard Rd Unit 41
- 13 Pullard Rd Unit 40
- 13 Pullard Rd Unit 39
- 13 Pullard Rd Unit 37
- 13 Pullard Rd Unit 36
- 13 Pullard Rd Unit 35
- 13 Pullard Rd Unit 34
- 13 Pullard Rd Unit 33
- 13 Pullard Rd Unit 32
- 13 Pullard Rd Unit 31
Your Personal Tour Guide
Ask me questions while you tour the home.