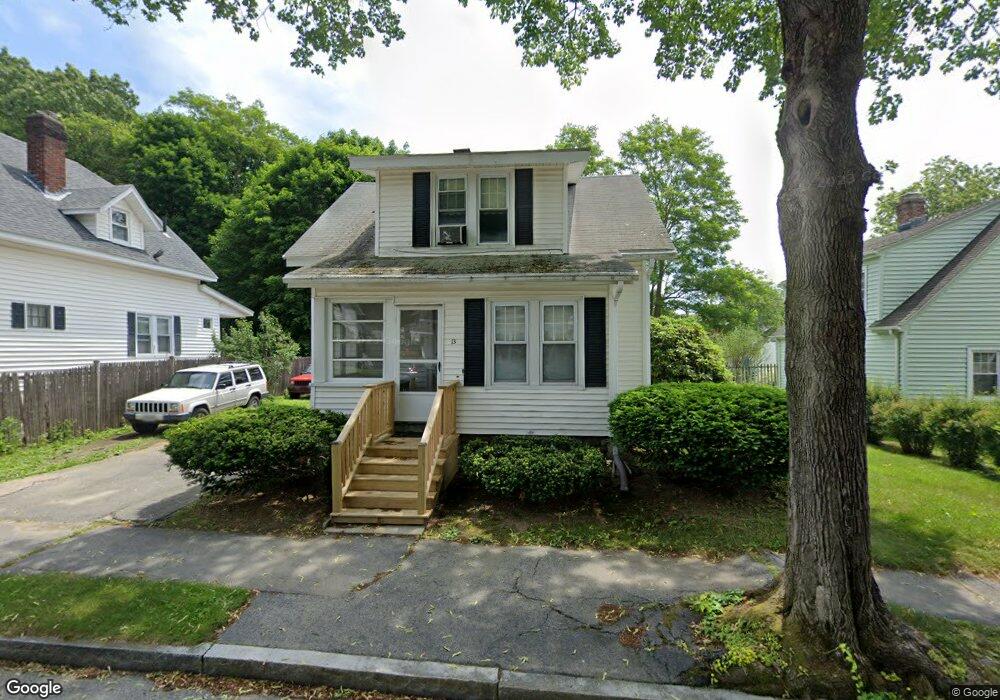
13 Reed St Worcester, MA 01602
Columbus Park NeighborhoodEstimated Value: $364,000 - $412,000
2
Beds
2
Baths
1,058
Sq Ft
$369/Sq Ft
Est. Value
About This Home
This home is located at 13 Reed St, Worcester, MA 01602 and is currently estimated at $390,220, approximately $368 per square foot. 13 Reed St is a home located in Worcester County with nearby schools including Chandler Magnet, Jacob Hiatt Magnet School, and May Street Elementary School.
Ownership History
Date
Name
Owned For
Owner Type
Purchase Details
Closed on
Oct 24, 2007
Sold by
Simonian Kenneth C
Bought by
Winters Christine A and Winters Timothy C
Current Estimated Value
Home Financials for this Owner
Home Financials are based on the most recent Mortgage that was taken out on this home.
Original Mortgage
$196,650
Outstanding Balance
$123,921
Interest Rate
6.39%
Mortgage Type
Purchase Money Mortgage
Estimated Equity
$266,299
Purchase Details
Closed on
Jan 16, 2004
Sold by
Simonian Diana M
Bought by
Simonian Kenneth C
Create a Home Valuation Report for This Property
The Home Valuation Report is an in-depth analysis detailing your home's value as well as a comparison with similar homes in the area
Home Values in the Area
Average Home Value in this Area
Purchase History
| Date | Buyer | Sale Price | Title Company |
|---|---|---|---|
| Winters Christine A | $207,000 | -- | |
| Simonian Kenneth C | -- | -- |
Source: Public Records
Mortgage History
| Date | Status | Borrower | Loan Amount |
|---|---|---|---|
| Open | Winters Christine A | $196,650 |
Source: Public Records
Tax History Compared to Growth
Tax History
| Year | Tax Paid | Tax Assessment Tax Assessment Total Assessment is a certain percentage of the fair market value that is determined by local assessors to be the total taxable value of land and additions on the property. | Land | Improvement |
|---|---|---|---|---|
| 2025 | $3,945 | $299,100 | $111,000 | $188,100 |
| 2024 | $3,895 | $283,300 | $111,000 | $172,300 |
| 2023 | $3,736 | $260,500 | $96,500 | $164,000 |
| 2022 | $3,413 | $224,400 | $77,200 | $147,200 |
| 2021 | $3,219 | $197,700 | $61,800 | $135,900 |
| 2020 | $3,182 | $187,200 | $61,800 | $125,400 |
| 2019 | $3,029 | $168,300 | $55,500 | $112,800 |
| 2018 | $3,041 | $160,800 | $55,500 | $105,300 |
| 2017 | $2,935 | $152,700 | $55,500 | $97,200 |
| 2016 | $2,881 | $139,800 | $41,500 | $98,300 |
| 2015 | $2,806 | $139,800 | $41,500 | $98,300 |
| 2014 | $2,732 | $139,800 | $41,500 | $98,300 |
Source: Public Records
Map
Nearby Homes
- 2 Carlisle St
- 96 June St Unit 3
- 371 Chandler St Unit 2
- 250 May St
- 346 Lovell St
- 53 Howland Terrace
- 40 Howland Terrace
- 4 Longfellow Rd
- 18 Zenith Dr
- 83 Commodore Rd
- 16 Sherwood Rd
- 10 Minthorne St
- 41 Walnut Hill Dr
- 1 Clive St
- 62 Circuit Ave N
- 23 Roy St
- 5 Coombs Rd
- 5 Lisbon St
- 574 Pleasant St
- 11 Isabella St