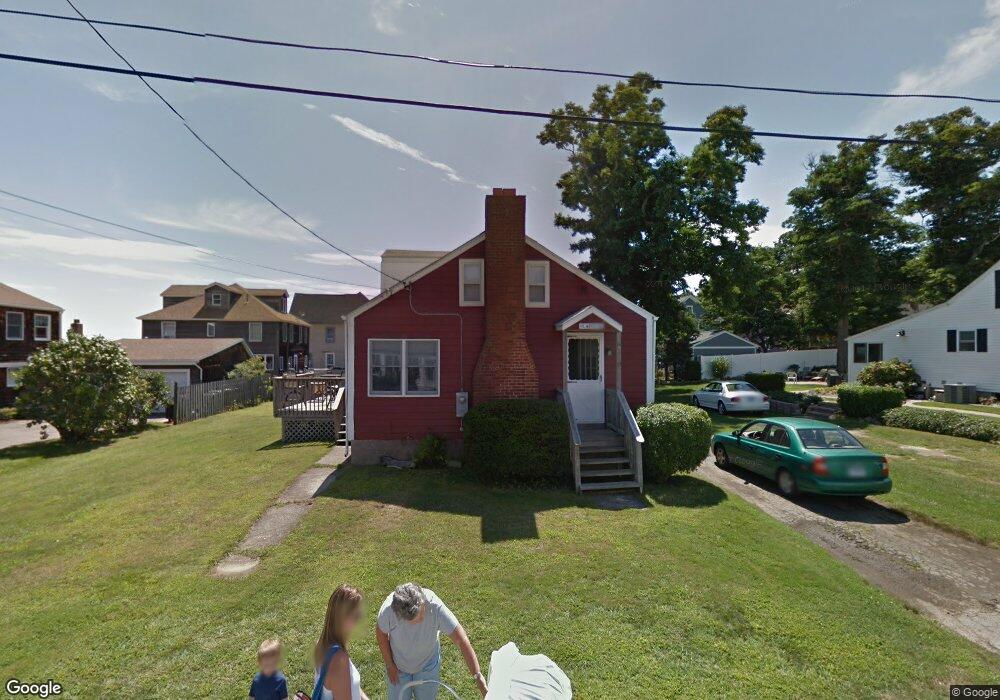
13 Rockwell St Niantic, CT 06357
Estimated Value: $706,463 - $845,000
3
Beds
2
Baths
1,210
Sq Ft
$633/Sq Ft
Est. Value
About This Home
This home is located at 13 Rockwell St, Niantic, CT 06357 and is currently estimated at $766,116, approximately $633 per square foot. 13 Rockwell St is a home located in New London County with nearby schools including East Lyme Middle School, East Lyme High School, and The Light House Voc-Ed Center.
Ownership History
Date
Name
Owned For
Owner Type
Purchase Details
Closed on
Jun 9, 1998
Sold by
Bartlett Horrace F
Bought by
Trombly Lisa and Trombly Prestun
Current Estimated Value
Home Financials for this Owner
Home Financials are based on the most recent Mortgage that was taken out on this home.
Original Mortgage
$45,000
Outstanding Balance
$8,675
Interest Rate
6.63%
Mortgage Type
Unknown
Estimated Equity
$757,441
Create a Home Valuation Report for This Property
The Home Valuation Report is an in-depth analysis detailing your home's value as well as a comparison with similar homes in the area
Home Values in the Area
Average Home Value in this Area
Purchase History
| Date | Buyer | Sale Price | Title Company |
|---|---|---|---|
| Trombly Lisa | $30,500 | -- |
Source: Public Records
Mortgage History
| Date | Status | Borrower | Loan Amount |
|---|---|---|---|
| Open | Trombly Lisa | $45,000 |
Source: Public Records
Tax History Compared to Growth
Tax History
| Year | Tax Paid | Tax Assessment Tax Assessment Total Assessment is a certain percentage of the fair market value that is determined by local assessors to be the total taxable value of land and additions on the property. | Land | Improvement |
|---|---|---|---|---|
| 2025 | $9,631 | $343,840 | $251,160 | $92,680 |
| 2024 | $9,060 | $343,840 | $251,160 | $92,680 |
| 2023 | $8,555 | $343,840 | $251,160 | $92,680 |
| 2022 | $8,197 | $343,840 | $251,160 | $92,680 |
| 2021 | $6,452 | $226,310 | $169,330 | $56,980 |
| 2020 | $6,384 | $225,120 | $169,330 | $55,790 |
| 2019 | $6,346 | $225,120 | $169,330 | $55,790 |
| 2018 | $6,157 | $225,120 | $169,330 | $55,790 |
| 2017 | $5,889 | $225,120 | $169,330 | $55,790 |
| 2016 | $5,725 | $225,750 | $169,330 | $56,420 |
| 2015 | $5,578 | $225,750 | $169,330 | $56,420 |
| 2014 | $5,425 | $225,750 | $169,330 | $56,420 |
Source: Public Records
Map
Nearby Homes
- 43 Attawan Ave
- 5 Attawan Ave
- 48 Billow Rd
- 11 Sunset Ave
- 7 Old Black Point Rd
- 146 Black Point Rd
- 46 Old Black Point Rd
- 23 Central Ave
- 127 Black Point Rd Unit 7
- 61 Terrace Ave
- 68-70 Black Point Rd
- 15 Griswold Rd
- 9 Columbus Ave
- 43 Village Crossing Unit 43
- 40 Spinnaker Dr
- 47 Village Crossing Unit 47
- 3 Village Crossing Unit 3
- 46 Village Crossing Unit 46
- 48 Village Crossing Unit 48
- 3 Pattagansett Ct