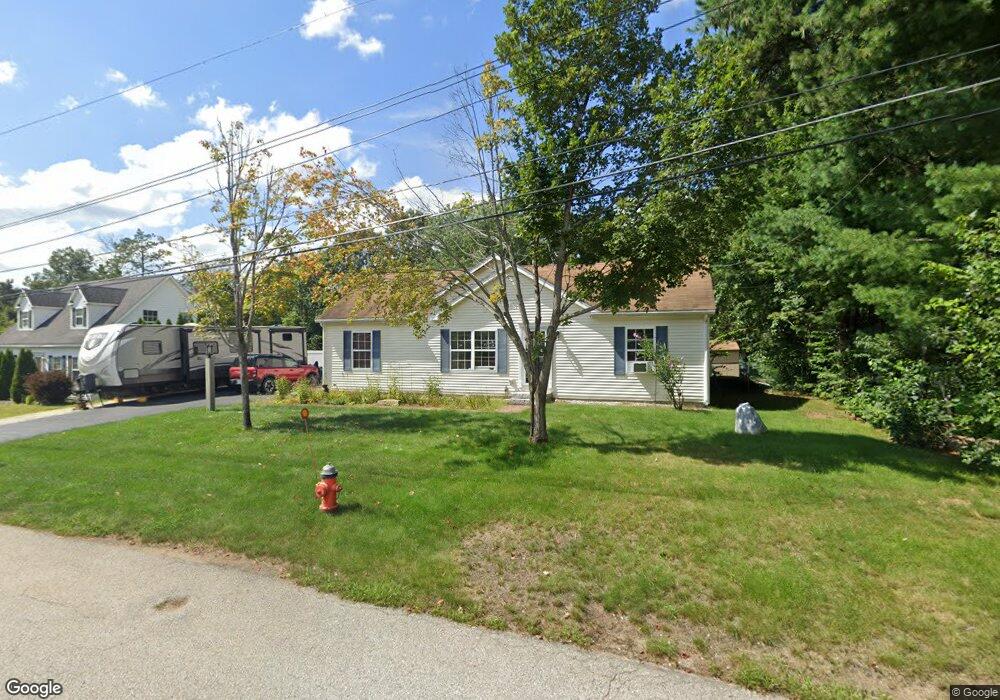
13 Roy St Concord, NH 03301
Concord Heights NeighborhoodEstimated Value: $432,000 - $477,000
3
Beds
2
Baths
1,248
Sq Ft
$363/Sq Ft
Est. Value
About This Home
This home is located at 13 Roy St, Concord, NH 03301 and is currently estimated at $453,552, approximately $363 per square foot. 13 Roy St is a home located in Merrimack County with nearby schools including Broken Ground School, Rundlett Middle School, and Concord High School.
Ownership History
Date
Name
Owned For
Owner Type
Purchase Details
Closed on
Apr 20, 2012
Sold by
Weeks Susan J
Bought by
Weeks Ft
Current Estimated Value
Purchase Details
Closed on
Aug 26, 2004
Sold by
Wellington Way Props L
Bought by
Weeks Susan J
Home Financials for this Owner
Home Financials are based on the most recent Mortgage that was taken out on this home.
Original Mortgage
$198,000
Interest Rate
6.02%
Mortgage Type
Purchase Money Mortgage
Create a Home Valuation Report for This Property
The Home Valuation Report is an in-depth analysis detailing your home's value as well as a comparison with similar homes in the area
Home Values in the Area
Average Home Value in this Area
Purchase History
| Date | Buyer | Sale Price | Title Company |
|---|---|---|---|
| Weeks Ft | -- | -- | |
| Weeks Susan J | $75,000 | -- |
Source: Public Records
Mortgage History
| Date | Status | Borrower | Loan Amount |
|---|---|---|---|
| Open | Weeks Susan J | $135,500 | |
| Previous Owner | Weeks Susan J | $25,000 | |
| Previous Owner | Weeks Susan J | $122,000 | |
| Previous Owner | Weeks Susan J | $198,000 |
Source: Public Records
Tax History Compared to Growth
Tax History
| Year | Tax Paid | Tax Assessment Tax Assessment Total Assessment is a certain percentage of the fair market value that is determined by local assessors to be the total taxable value of land and additions on the property. | Land | Improvement |
|---|---|---|---|---|
| 2024 | $8,127 | $293,500 | $103,900 | $189,600 |
| 2023 | $7,883 | $293,500 | $103,900 | $189,600 |
| 2022 | $7,599 | $293,500 | $103,900 | $189,600 |
| 2021 | $7,373 | $293,500 | $103,900 | $189,600 |
| 2020 | $6,947 | $259,600 | $76,200 | $183,400 |
| 2019 | $6,892 | $248,100 | $72,900 | $175,200 |
| 2018 | $6,408 | $227,300 | $72,900 | $154,400 |
| 2017 | $5,916 | $209,500 | $69,400 | $140,100 |
| 2016 | $5,700 | $206,000 | $69,400 | $136,600 |
| 2015 | $5,348 | $188,800 | $69,400 | $119,400 |
| 2014 | $5,062 | $188,800 | $69,400 | $119,400 |
| 2013 | -- | $185,600 | $69,400 | $116,200 |
| 2012 | -- | $183,500 | $69,400 | $114,100 |
Source: Public Records
Map
Nearby Homes
- 43 Branch Turnpike
- 50 Branch Turnpike
- 13 Ellsworth St
- 59 Branch Turnpike
- 1 Guay St
- 12 E Side Dr Unit 4-13
- 24 Cricket Ln
- 32 E Side Dr
- 8 NE Village Rd
- 17 Burns Ave Unit 2
- 294 Portsmouth St
- 6 Heights Rd
- 4 Venne Cir
- 6 Lawrence Street Extension
- 19 Grappone Dr
- 33 Mulberry St Unit 2
- 15 Bridle Path Trail
- 9 Strawberry Ln
- 7 Highridge Trail
- 69 Manchester St Unit Lot 18