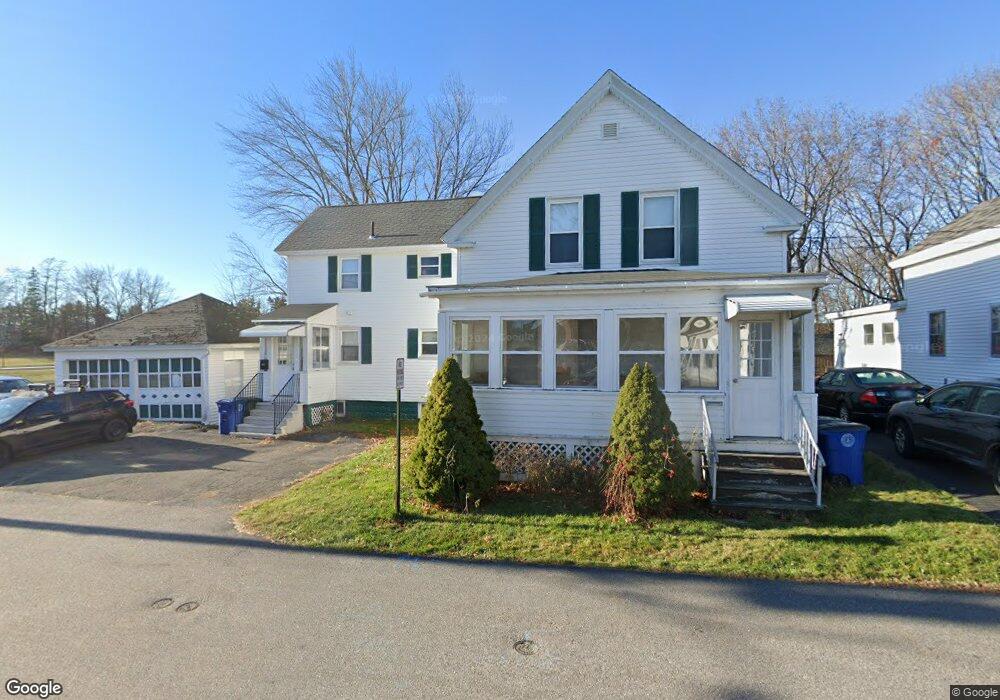
13 School St Westbrook, ME 04092
Estimated Value: $473,612 - $582,000
4
Beds
2
Baths
2,263
Sq Ft
$235/Sq Ft
Est. Value
About This Home
This home is located at 13 School St, Westbrook, ME 04092 and is currently estimated at $532,903, approximately $235 per square foot. 13 School St is a home located in Cumberland County with nearby schools including Westbrook High School, Breakwater School, and The Little Dolphin School Foundation.
Ownership History
Date
Name
Owned For
Owner Type
Purchase Details
Closed on
Jan 4, 2016
Sold by
Lannon Jennifer L and Walton Joshua T
Bought by
Lannon Jennfier L
Current Estimated Value
Home Financials for this Owner
Home Financials are based on the most recent Mortgage that was taken out on this home.
Original Mortgage
$205,840
Outstanding Balance
$163,816
Interest Rate
3.98%
Mortgage Type
FHA
Estimated Equity
$369,087
Purchase Details
Closed on
Sep 14, 2007
Sold by
Cary T
Bought by
Lannon Jennifer L and Walton Joshua T
Home Financials for this Owner
Home Financials are based on the most recent Mortgage that was taken out on this home.
Original Mortgage
$202,817
Interest Rate
6.7%
Mortgage Type
FHA
Create a Home Valuation Report for This Property
The Home Valuation Report is an in-depth analysis detailing your home's value as well as a comparison with similar homes in the area
Home Values in the Area
Average Home Value in this Area
Purchase History
| Date | Buyer | Sale Price | Title Company |
|---|---|---|---|
| Lannon Jennfier L | -- | -- | |
| Lannon Jennifer L | -- | -- |
Source: Public Records
Mortgage History
| Date | Status | Borrower | Loan Amount |
|---|---|---|---|
| Open | Lannon Jennfier L | $205,840 | |
| Closed | Lannon Jennifer L | $202,889 | |
| Closed | Lannon Jennifer L | $202,817 |
Source: Public Records
Tax History
| Year | Tax Paid | Tax Assessment Tax Assessment Total Assessment is a certain percentage of the fair market value that is determined by local assessors to be the total taxable value of land and additions on the property. | Land | Improvement |
|---|---|---|---|---|
| 2023 | $5,047 | $302,600 | $80,700 | $221,900 |
| 2022 | $4,577 | $252,900 | $67,300 | $185,600 |
| 2021 | $4,509 | $252,900 | $67,300 | $185,600 |
| 2020 | $4,517 | $252,900 | $67,300 | $185,600 |
| 2019 | $4,517 | $252,900 | $67,300 | $185,600 |
| 2018 | $3,862 | $198,900 | $58,500 | $140,400 |
| 2017 | $2,103 | $198,900 | $58,500 | $140,400 |
| 2016 | $3,660 | $198,900 | $58,500 | $140,400 |
| 2015 | $3,572 | $198,900 | $58,500 | $140,400 |
| 2014 | $3,421 | $198,900 | $58,500 | $140,400 |
| 2013 | $3,421 | $198,900 | $58,500 | $140,400 |
Source: Public Records
Map
Nearby Homes
- 21 Clover Ln Unit 109
- 21 Clover Ln Unit 210
- 21 Clover Ln Unit 306
- 21 Clover Ln Unit 112
- 21 Clover Ln Unit 407
- 21 Clover Ln Unit 207
- 21 Clover Ln Unit 212
- 21 Clover Ln Unit 107
- 21 Clover Ln Unit 209
- 21 Clover Ln Unit 104
- 26 King St Unit 1
- 20 Taggart Ave
- 141 Rochester St
- 78 North St
- 18 Cole St
- 25 Cole St Unit 2
- 10 Everett Ct
- 383 Main St
- 132 North St
- 11 Anderson Ave
Your Personal Tour Guide
Ask me questions while you tour the home.