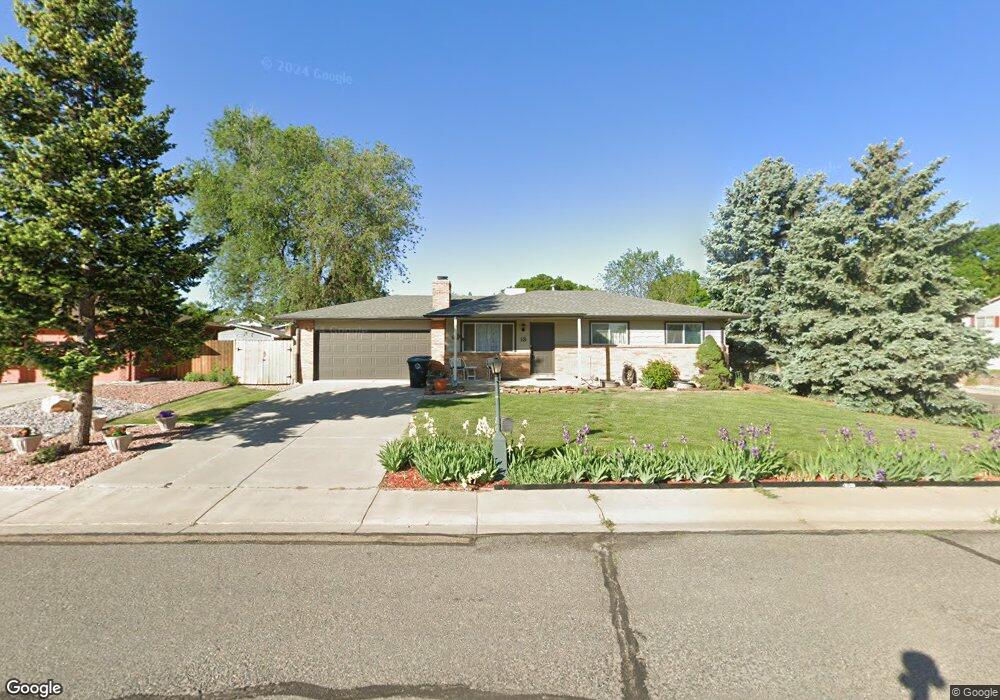
13 Seattle Ln Longmont, CO 80501
Southmoor NeighborhoodEstimated Value: $505,000 - $554,981
5
Beds
2
Baths
2,128
Sq Ft
$253/Sq Ft
Est. Value
About This Home
This home is located at 13 Seattle Ln, Longmont, CO 80501 and is currently estimated at $538,745, approximately $253 per square foot. 13 Seattle Ln is a home located in Boulder County with nearby schools including Burlington Elementary School, Sunset Middle School, and Niwot High School.
Ownership History
Date
Name
Owned For
Owner Type
Purchase Details
Closed on
Jul 15, 2016
Sold by
Msb Group Llc
Bought by
Carsten Bradley Joel
Current Estimated Value
Home Financials for this Owner
Home Financials are based on the most recent Mortgage that was taken out on this home.
Original Mortgage
$168,500
Outstanding Balance
$134,340
Interest Rate
3.54%
Mortgage Type
New Conventional
Estimated Equity
$404,405
Purchase Details
Closed on
Mar 11, 2016
Sold by
Liberty Capital Properties Llc
Bought by
Msb Group Llc
Purchase Details
Closed on
Dec 16, 2013
Sold by
Johansson Glenn A
Bought by
Liberty Capital Properties Llc
Home Financials for this Owner
Home Financials are based on the most recent Mortgage that was taken out on this home.
Original Mortgage
$178,000
Interest Rate
4.21%
Mortgage Type
Seller Take Back
Purchase Details
Closed on
May 27, 2010
Sold by
Millward Andrew and Millward April S
Bought by
Johansson Glenn A
Home Financials for this Owner
Home Financials are based on the most recent Mortgage that was taken out on this home.
Original Mortgage
$187,475
Interest Rate
5.5%
Mortgage Type
FHA
Purchase Details
Closed on
Aug 28, 2006
Sold by
Millward Andrew
Bought by
Millward Andrew and Millward April S
Purchase Details
Closed on
Jun 9, 2006
Sold by
Murray Renovations Llc
Bought by
Millward Andrew
Home Financials for this Owner
Home Financials are based on the most recent Mortgage that was taken out on this home.
Original Mortgage
$208,724
Interest Rate
6.58%
Mortgage Type
FHA
Purchase Details
Closed on
Jan 6, 2006
Sold by
Murray Michael T and Murray Sabrina L
Bought by
Murray Renovations Llc
Purchase Details
Closed on
Oct 19, 2005
Sold by
Prentup Frank D and Prentup Paula J
Bought by
Murray Michael T
Purchase Details
Closed on
Mar 14, 1997
Sold by
Ward Karla K
Bought by
Prentup Frank D
Home Financials for this Owner
Home Financials are based on the most recent Mortgage that was taken out on this home.
Original Mortgage
$87,500
Interest Rate
7.89%
Purchase Details
Closed on
Aug 8, 1995
Sold by
Ward Michael R
Bought by
Ward Karla K
Home Financials for this Owner
Home Financials are based on the most recent Mortgage that was taken out on this home.
Original Mortgage
$6,000
Interest Rate
8.24%
Mortgage Type
Seller Take Back
Purchase Details
Closed on
Dec 28, 1989
Bought by
Carsten Bradley Joel
Purchase Details
Closed on
Nov 3, 1987
Bought by
Carsten Bradley Joel
Create a Home Valuation Report for This Property
The Home Valuation Report is an in-depth analysis detailing your home's value as well as a comparison with similar homes in the area
Home Values in the Area
Average Home Value in this Area
Purchase History
| Date | Buyer | Sale Price | Title Company |
|---|---|---|---|
| Carsten Bradley Joel | $340,000 | Land Title Guarantee Co | |
| Msb Group Llc | $235,000 | Land Title Guarantee Company | |
| Liberty Capital Properties Llc | $188,000 | None Available | |
| Johansson Glenn A | $190,000 | None Available | |
| Millward Andrew | -- | None Available | |
| Millward Andrew | $212,000 | North Amer Title Co Of Co | |
| Murray Renovations Llc | -- | None Available | |
| Murray Michael T | $174,800 | North Amer Title Co Of Co | |
| Prentup Frank D | $125,000 | First American Heritage Titl | |
| Ward Karla K | -- | -- | |
| Carsten Bradley Joel | $73,100 | -- | |
| Carsten Bradley Joel | $76,000 | -- |
Source: Public Records
Mortgage History
| Date | Status | Borrower | Loan Amount |
|---|---|---|---|
| Open | Carsten Bradley Joel | $168,500 | |
| Previous Owner | Liberty Capital Properties Llc | $178,000 | |
| Previous Owner | Johansson Glenn A | $187,475 | |
| Previous Owner | Millward Andrew | $208,724 | |
| Previous Owner | Prentup Frank D | $87,500 | |
| Previous Owner | Ward Karla K | $6,000 |
Source: Public Records
Tax History Compared to Growth
Tax History
| Year | Tax Paid | Tax Assessment Tax Assessment Total Assessment is a certain percentage of the fair market value that is determined by local assessors to be the total taxable value of land and additions on the property. | Land | Improvement |
|---|---|---|---|---|
| 2025 | $3,104 | $33,294 | $12,294 | $21,000 |
| 2024 | $3,104 | $33,294 | $12,294 | $21,000 |
| 2023 | $3,062 | $32,455 | $15,350 | $20,790 |
| 2022 | $3,073 | $27,501 | $10,842 | $16,659 |
| 2021 | $2,757 | $28,293 | $11,154 | $17,139 |
| 2020 | $2,422 | $24,932 | $9,009 | $15,923 |
| 2019 | $2,384 | $24,932 | $9,009 | $15,923 |
| 2018 | $2,066 | $21,751 | $6,264 | $15,487 |
| 2017 | $2,038 | $24,047 | $6,925 | $17,122 |
| 2016 | $1,672 | $17,488 | $6,209 | $11,279 |
| 2015 | $1,593 | $14,615 | $4,378 | $10,237 |
| 2014 | $1,365 | $14,615 | $4,378 | $10,237 |
Source: Public Records
Map
Nearby Homes
- 9 Seattle Ln
- 1343 S Coffman St
- 1328 S Terry St
- 750 Satisfaction Cir
- 740 Satisfaction Cir
- 730 Satisfaction Cir
- 720 Satisfaction Cir
- 710 Satisfaction Cir
- 802 Neon Forest Cir
- 421 Noel Ave
- 1435 Ashcroft Dr
- 1208 S Coffman St
- 1028 Katy Ln
- 1305 Kestrel Ln Unit J
- 1221 S Main St
- 2018 Ionosphere St Unit 7
- 2018 Ionosphere St Unit 3
- 2018 Ionosphere St Unit 8
- 1801 S Pratt Pkwy
- 1072 Kane Dr
- 11 Seattle Ln
- 14 Texas Ln
- 1427 S Coffman St
- 1421 S Coffman St
- 10 Seattle Ln
- 8 Seattle Ln
- 12 Texas Ln
- 1433 S Coffman St
- 1415 S Coffman St
- 1439 S Coffman St
- 10 Texas Ln
- 7 Seattle Ln
- 1409 S Coffman St
- 6 Seattle Ln
- 1422 S Terry St
- 1428 S Terry St
- 1416 S Terry St
- 1400 S Coffman St
- 1500 S Coffman St
- 1434 S Terry St