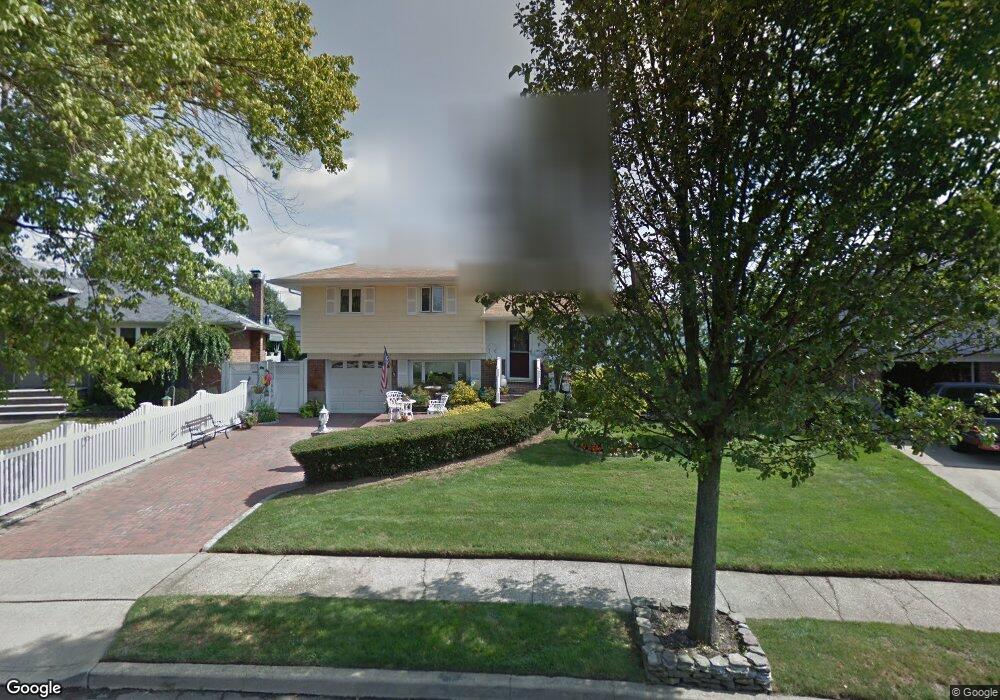
13 Shelly Ln Bethpage, NY 11714
Estimated Value: $755,000 - $780,159
3
Beds
2
Baths
1,412
Sq Ft
$544/Sq Ft
Est. Value
About This Home
This home is located at 13 Shelly Ln, Bethpage, NY 11714 and is currently estimated at $767,580, approximately $543 per square foot. 13 Shelly Ln is a home located in Nassau County with nearby schools including John H. West Elementary School, Plainedge Middle School, and Plainedge Senior High School.
Ownership History
Date
Name
Owned For
Owner Type
Purchase Details
Closed on
Jul 31, 2013
Sold by
Clifford Jane and Clifford Michael T
Bought by
Mckee Jill
Current Estimated Value
Home Financials for this Owner
Home Financials are based on the most recent Mortgage that was taken out on this home.
Original Mortgage
$327,250
Outstanding Balance
$242,585
Interest Rate
4.31%
Estimated Equity
$524,995
Purchase Details
Closed on
Jun 15, 2011
Sold by
Clifford Michael J
Bought by
Clifford Michael J and Clifford Jane
Create a Home Valuation Report for This Property
The Home Valuation Report is an in-depth analysis detailing your home's value as well as a comparison with similar homes in the area
Home Values in the Area
Average Home Value in this Area
Purchase History
| Date | Buyer | Sale Price | Title Company |
|---|---|---|---|
| Mckee Jill | -- | -- | |
| Clifford Michael J | -- | -- |
Source: Public Records
Mortgage History
| Date | Status | Borrower | Loan Amount |
|---|---|---|---|
| Open | Mckee Jill | $327,250 |
Source: Public Records
Tax History Compared to Growth
Tax History
| Year | Tax Paid | Tax Assessment Tax Assessment Total Assessment is a certain percentage of the fair market value that is determined by local assessors to be the total taxable value of land and additions on the property. | Land | Improvement |
|---|---|---|---|---|
| 2025 | $13,830 | $461 | $219 | $242 |
| 2024 | $4,387 | $471 | $223 | $248 |
| 2023 | $12,367 | $481 | $228 | $253 |
| 2022 | $12,367 | $483 | $229 | $254 |
| 2021 | $11,981 | $479 | $227 | $252 |
| 2020 | $11,696 | $592 | $546 | $46 |
| 2019 | $11,165 | $592 | $426 | $166 |
| 2018 | $10,284 | $592 | $0 | $0 |
| 2017 | $8,262 | $758 | $489 | $269 |
| 2016 | $12,158 | $846 | $546 | $300 |
| 2015 | $3,835 | $846 | $546 | $300 |
| 2014 | $3,835 | $846 | $546 | $300 |
| 2013 | $3,478 | $846 | $546 | $300 |
Source: Public Records
Map
Nearby Homes