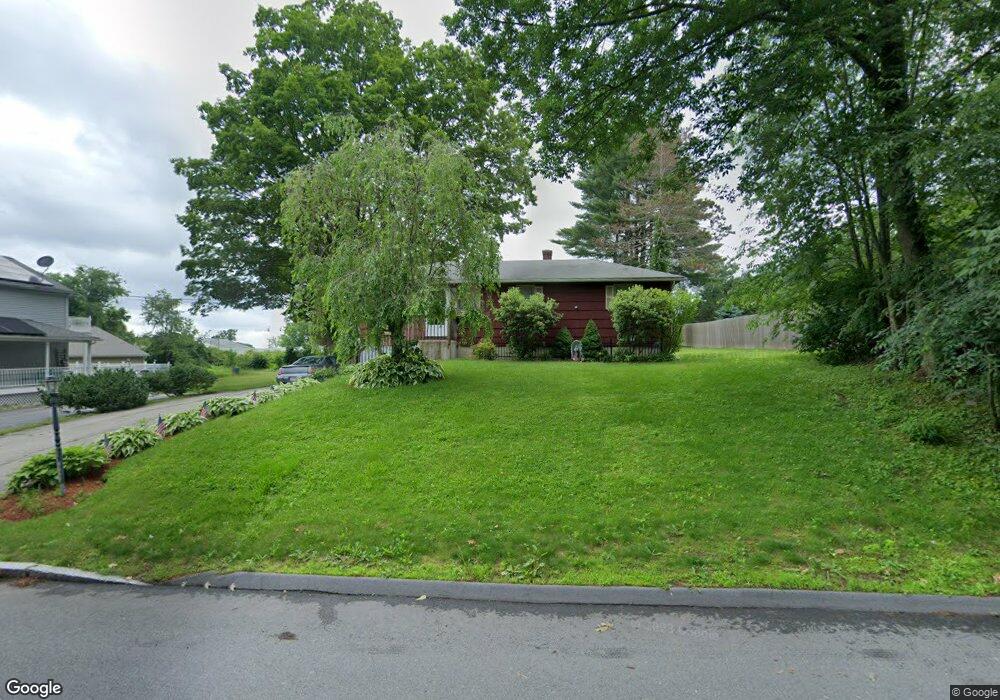
13 Sibley St Auburn, MA 01501
West Auburn NeighborhoodEstimated Value: $291,000 - $381,000
3
Beds
2
Baths
846
Sq Ft
$411/Sq Ft
Est. Value
About This Home
This home is located at 13 Sibley St, Auburn, MA 01501 and is currently estimated at $347,962, approximately $411 per square foot. 13 Sibley St is a home located in Worcester County with nearby schools including Auburn Senior High School and Shrewsbury Montessori School - Auburn Campus.
Ownership History
Date
Name
Owned For
Owner Type
Purchase Details
Closed on
Jan 25, 2022
Sold by
Kelley Richard
Bought by
Kelley Richard and Swanstrom Steven E
Current Estimated Value
Purchase Details
Closed on
Sep 10, 2018
Sold by
Kelley Elizabeth A and Swanstrom Steven E
Bought by
Kelley Richard
Purchase Details
Closed on
Oct 4, 1978
Bought by
Swanstrom Elizabeth A
Create a Home Valuation Report for This Property
The Home Valuation Report is an in-depth analysis detailing your home's value as well as a comparison with similar homes in the area
Home Values in the Area
Average Home Value in this Area
Purchase History
| Date | Buyer | Sale Price | Title Company |
|---|---|---|---|
| Kelley Richard | -- | None Available | |
| Kelley Richard | -- | -- | |
| Swanstrom Elizabeth A | -- | -- |
Source: Public Records
Mortgage History
| Date | Status | Borrower | Loan Amount |
|---|---|---|---|
| Previous Owner | Swanstrom Elizabeth A | $25,000 | |
| Previous Owner | Swanstrom Elizabeth A | $60,000 |
Source: Public Records
Tax History Compared to Growth
Tax History
| Year | Tax Paid | Tax Assessment Tax Assessment Total Assessment is a certain percentage of the fair market value that is determined by local assessors to be the total taxable value of land and additions on the property. | Land | Improvement |
|---|---|---|---|---|
| 2025 | $41 | $283,400 | $109,200 | $174,200 |
| 2024 | $3,998 | $267,800 | $104,000 | $163,800 |
| 2023 | $3,851 | $242,500 | $94,600 | $147,900 |
| 2022 | $3,747 | $222,800 | $94,600 | $128,200 |
| 2021 | $3,465 | $191,000 | $83,500 | $107,500 |
| 2020 | $3,434 | $191,000 | $83,500 | $107,500 |
| 2019 | $3,122 | $169,500 | $78,300 | $91,200 |
| 2018 | $3,466 | $154,900 | $73,200 | $81,700 |
| 2017 | $2,716 | $148,100 | $66,400 | $81,700 |
| 2016 | $2,609 | $144,200 | $69,500 | $74,700 |
| 2015 | $2,480 | $143,700 | $69,500 | $74,200 |
| 2014 | $2,334 | $135,000 | $66,200 | $68,800 |
Source: Public Records
Map
Nearby Homes