13 Snapit Rd Carver, MA 02330
Estimated Value: $771,000 - $951,000
4
Beds
3
Baths
2,752
Sq Ft
$312/Sq Ft
Est. Value
About This Home
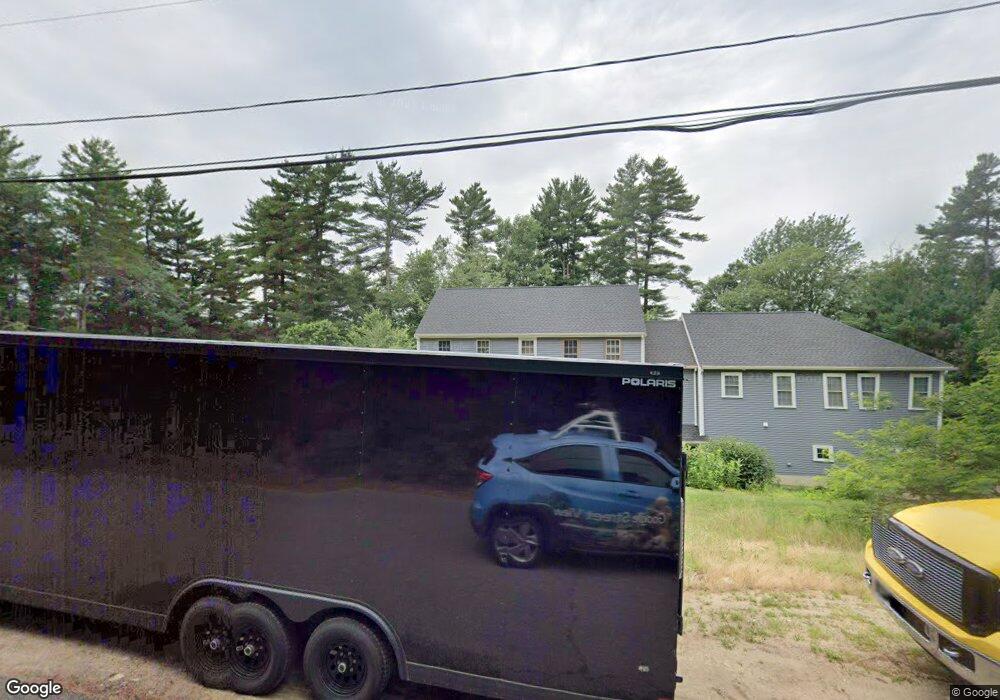
This home is located at 13 Snapit Rd, Carver, MA 02330 and is currently estimated at $858,682, approximately $312 per square foot. 13 Snapit Rd is a home located in Plymouth County with nearby schools including Carver Elementary School, Carver Middle/High School, and Sacred Heart High School.
Ownership History
Date
Name
Owned For
Owner Type
Purchase Details
Closed on
Aug 18, 2004
Sold by
Ragazzini Dennis J
Bought by
Ragazzini Dennis J and Ragazzini Stacey E
Current Estimated Value
Home Financials for this Owner
Home Financials are based on the most recent Mortgage that was taken out on this home.
Original Mortgage
$309,300
Interest Rate
6.03%
Mortgage Type
Purchase Money Mortgage
Create a Home Valuation Report for This Property
The Home Valuation Report is an in-depth analysis detailing your home's value as well as a comparison with similar homes in the area
Home Values in the Area
Average Home Value in this Area
Purchase History
| Date | Buyer | Sale Price | Title Company |
|---|---|---|---|
| Ragazzini Dennis J | -- | -- |
Source: Public Records
Mortgage History
| Date | Status | Borrower | Loan Amount |
|---|---|---|---|
| Open | Ragazzini Dennis J | $370,600 | |
| Closed | Ragazzini Dennis J | $340,000 | |
| Closed | Ragazzini Dennis J | $309,300 | |
| Previous Owner | Ragazzini Dennis J | $222,500 |
Source: Public Records
Tax History
| Year | Tax Paid | Tax Assessment Tax Assessment Total Assessment is a certain percentage of the fair market value that is determined by local assessors to be the total taxable value of land and additions on the property. | Land | Improvement |
|---|---|---|---|---|
| 2025 | $9,971 | $718,900 | $155,000 | $563,900 |
| 2024 | $7,203 | $508,300 | $151,900 | $356,400 |
| 2023 | $6,943 | $475,900 | $151,900 | $324,000 |
| 2022 | $6,613 | $413,800 | $129,900 | $283,900 |
| 2021 | $6,500 | $383,700 | $116,000 | $267,700 |
| 2020 | $6,250 | $363,600 | $108,400 | $255,200 |
| 2019 | $6,029 | $353,600 | $105,200 | $248,400 |
| 2018 | $5,864 | $332,600 | $105,200 | $227,400 |
| 2017 | $5,618 | $317,600 | $101,200 | $216,400 |
| 2016 | $5,332 | $313,100 | $103,500 | $209,600 |
| 2015 | $5,186 | $304,900 | $103,500 | $201,400 |
| 2014 | $5,134 | $301,800 | $130,800 | $171,000 |
Source: Public Records
Map
Nearby Homes
- 0 Spring St
- 11 Brockton Ave
- 6 Twin Pines Ln Unit 6
- 125 Brook St
- 42 Christmas Tree Ln
- 26 Santana Way Unit 26
- 25 Dukes Brook Rd
- 13 Pond View Way
- 35 Silva St
- 81 Center St
- 56 Bunnys Rd
- 25 Old Center St
- 241 Carver Rd Unit 7
- 103 Esta Rd
- 61 Esta Rd
- 6 Coachman Terrace
- 34 Surrey Dr
- 10 Coachman Terrace
- 1 Pinehurst Dr
- 0 Weathervane Dr Unit 7
Your Personal Tour Guide
Ask me questions while you tour the home.