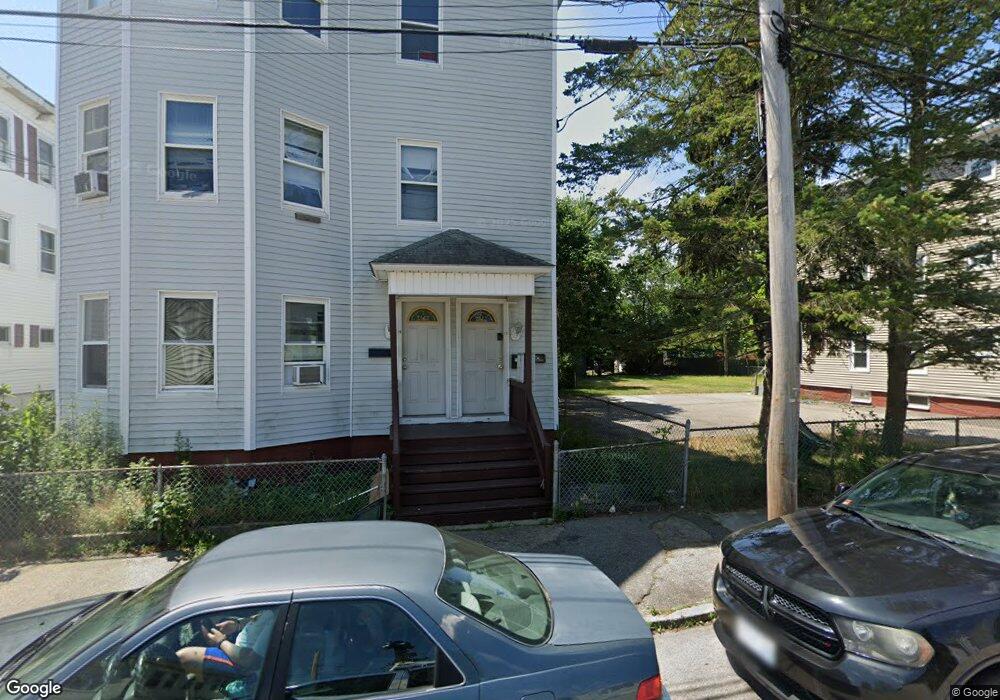
13 Stearns St Pawtucket, RI 02861
Darlington NeighborhoodEstimated Value: $649,000 - $673,000
9
Beds
3
Baths
3,201
Sq Ft
$206/Sq Ft
Est. Value
About This Home
This home is located at 13 Stearns St, Pawtucket, RI 02861 and is currently estimated at $661,000, approximately $206 per square foot. 13 Stearns St is a home located in Providence County with nearby schools including St Cecilia School and Dayspring Christian Academy.
Ownership History
Date
Name
Owned For
Owner Type
Purchase Details
Closed on
Dec 22, 2015
Sold by
Casey Realty
Bought by
Rosa Jose L
Current Estimated Value
Home Financials for this Owner
Home Financials are based on the most recent Mortgage that was taken out on this home.
Original Mortgage
$80,000
Outstanding Balance
$63,137
Interest Rate
3.89%
Estimated Equity
$597,863
Purchase Details
Closed on
Dec 10, 1999
Sold by
Rego David T and Rego Alda E
Bought by
Tavares Paulo A and Tavares Odelisa S
Create a Home Valuation Report for This Property
The Home Valuation Report is an in-depth analysis detailing your home's value as well as a comparison with similar homes in the area
Home Values in the Area
Average Home Value in this Area
Purchase History
| Date | Buyer | Sale Price | Title Company |
|---|---|---|---|
| Rosa Jose L | $125,000 | -- | |
| Tavares Paulo A | $147,000 | -- |
Source: Public Records
Mortgage History
| Date | Status | Borrower | Loan Amount |
|---|---|---|---|
| Open | Rosa Jose L | $80,000 | |
| Previous Owner | Tavares Paulo A | $244,000 | |
| Previous Owner | Tavares Paulo A | $244,000 | |
| Previous Owner | Tavares Paulo A | $52,000 | |
| Previous Owner | Tavares Paulo A | $5,513 |
Source: Public Records
Tax History
| Year | Tax Paid | Tax Assessment Tax Assessment Total Assessment is a certain percentage of the fair market value that is determined by local assessors to be the total taxable value of land and additions on the property. | Land | Improvement |
|---|---|---|---|---|
| 2025 | $6,220 | $473,000 | $114,800 | $358,200 |
| 2024 | $5,837 | $473,000 | $114,800 | $358,200 |
| 2023 | $5,514 | $325,500 | $71,800 | $253,700 |
| 2022 | $5,397 | $325,500 | $71,800 | $253,700 |
| 2021 | $5,397 | $325,500 | $71,800 | $253,700 |
| 2020 | $4,314 | $206,500 | $56,700 | $149,800 |
| 2019 | $4,314 | $206,500 | $56,700 | $149,800 |
| 2018 | $4,157 | $206,500 | $56,700 | $149,800 |
| 2017 | $4,044 | $178,000 | $46,600 | $131,400 |
| 2016 | $3,896 | $178,000 | $46,600 | $131,400 |
| 2015 | $3,896 | $178,000 | $46,600 | $131,400 |
| 2014 | $3,060 | $132,700 | $46,600 | $86,100 |
Source: Public Records
Map
Nearby Homes
- 40 Linton St
- 179 Columbine Ave
- 215 Kenyon Ave
- 386 Mendon Ave
- 39 Chaplin St
- 83 Chaplin St
- 37 Turner St
- 61 Mendon Rd
- 79 Turner St
- 50 Pullman Ave Unit A
- 50 Pullman Ave Unit B
- 67 Norton St
- 548 Kenyon Ave Unit 25
- 548 Kenyon Ave Unit 4
- 25 Burke St
- 574 Central Ave
- 39 John St
- 41 Calder St
- 460 Collins St Unit 6
- 460 Collins St Unit 9
- 17 Stearns St
- 14 Adin St
- 2 Adin St
- 7 Stearns St
- 5 Stearns St
- 1 Stearns St
- 25 Stearns St
- 319 Kenyon Ave
- 210 Benefit St
- 11 Adin St
- 31 Stearns St
- 29 Stearns St Unit 2nd
- 200 Benefit St Unit 1F
- 200 Benefit St
- 22 Stearns St
- 218 Benefit St
- 302 Kenyon Ave
- 196 Benefit St
- 196 Benefit St Unit 3
- 196 Benefit St Unit 2
Your Personal Tour Guide
Ask me questions while you tour the home.