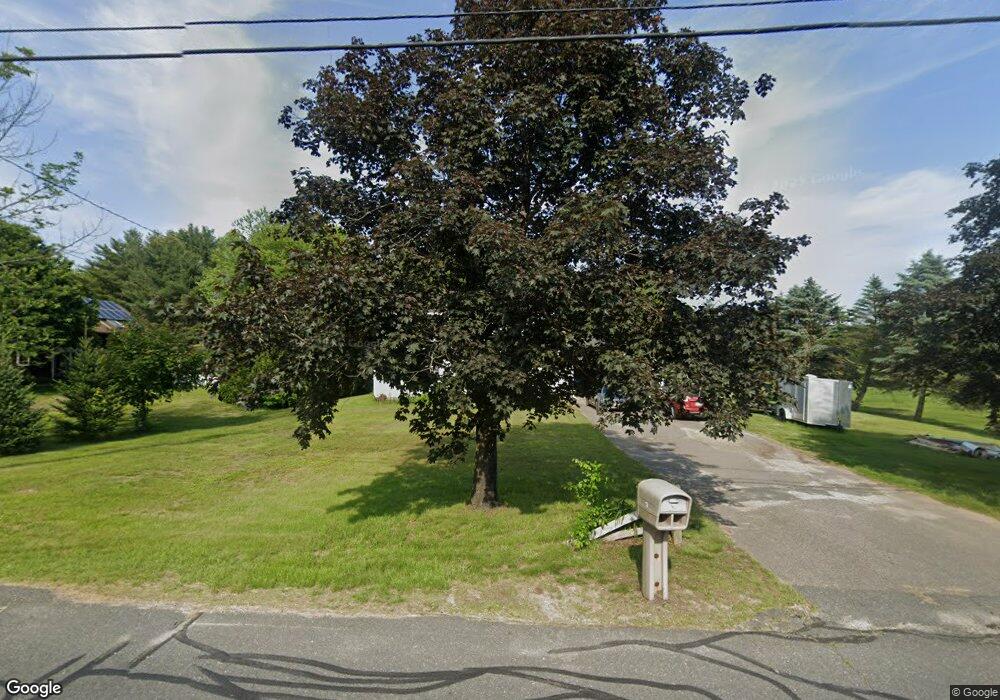
13 Strong Rd Southampton, MA 01073
Estimated Value: $506,000 - $542,000
4
Beds
3
Baths
2,040
Sq Ft
$255/Sq Ft
Est. Value
About This Home
This home is located at 13 Strong Rd, Southampton, MA 01073 and is currently estimated at $521,067, approximately $255 per square foot. 13 Strong Rd is a home located in Hampshire County with nearby schools including William E Norris School, Calvary Baptist Christian School, and White Oak School.
Ownership History
Date
Name
Owned For
Owner Type
Purchase Details
Closed on
Jan 21, 1997
Sold by
Pajak John R and Pajak Melody B
Bought by
Tripp David A and Tripp Jeanne M
Current Estimated Value
Home Financials for this Owner
Home Financials are based on the most recent Mortgage that was taken out on this home.
Original Mortgage
$148,000
Interest Rate
7.36%
Mortgage Type
Purchase Money Mortgage
Purchase Details
Closed on
Mar 7, 1996
Sold by
Fisher Floyd and Fisher Rebecca
Bought by
Pajak John R and Pajak Melody B
Purchase Details
Closed on
Mar 1, 1993
Sold by
Kenanley James M and Kenaley Patricia A
Bought by
Fisher Rebecca and Fisher Floyd
Create a Home Valuation Report for This Property
The Home Valuation Report is an in-depth analysis detailing your home's value as well as a comparison with similar homes in the area
Home Values in the Area
Average Home Value in this Area
Purchase History
| Date | Buyer | Sale Price | Title Company |
|---|---|---|---|
| Tripp David A | $168,000 | -- | |
| Pajak John R | $168,000 | -- | |
| Fisher Rebecca | $165,000 | -- |
Source: Public Records
Mortgage History
| Date | Status | Borrower | Loan Amount |
|---|---|---|---|
| Open | Fisher Rebecca | $115,000 | |
| Closed | Fisher Rebecca | $123,000 | |
| Closed | Fisher Rebecca | $148,000 |
Source: Public Records
Tax History Compared to Growth
Tax History
| Year | Tax Paid | Tax Assessment Tax Assessment Total Assessment is a certain percentage of the fair market value that is determined by local assessors to be the total taxable value of land and additions on the property. | Land | Improvement |
|---|---|---|---|---|
| 2025 | $5,650 | $398,700 | $96,200 | $302,500 |
| 2024 | $5,549 | $389,400 | $96,200 | $293,200 |
| 2023 | $5,152 | $359,500 | $96,200 | $263,300 |
| 2022 | $4,919 | $326,400 | $87,200 | $239,200 |
| 2021 | $4,547 | $284,700 | $81,500 | $203,200 |
| 2020 | $4,659 | $294,500 | $81,500 | $213,000 |
| 2019 | $5,680 | $276,900 | $81,500 | $195,400 |
| 2018 | $4,267 | $255,200 | $72,900 | $182,300 |
| 2017 | $5,271 | $255,200 | $72,900 | $182,300 |
| 2015 | $3,949 | $251,400 | $66,300 | $185,100 |
Source: Public Records
Map
Nearby Homes
- Lot 5 Gil Farm Rd
- Lot 6 Gil Farm Rd
- 119 Brickyard Rd
- Lot 5 Brickyard Rd
- 369 College Hwy
- 17 Maple St
- 14 Eastwood Dr
- Lot 57 White Loaf Rd
- 36 County Rd
- 95 Gunn Rd
- 36 Line St
- 100 Fomer Rd
- 22 Phelps St
- 1 Plain St
- 4 Fitch Farm Way
- 38 College Hwy
- 29 Rattle Hill Rd
- 16 Picard Cir
- 59 Campbell Dr
- 10 Golden Cir