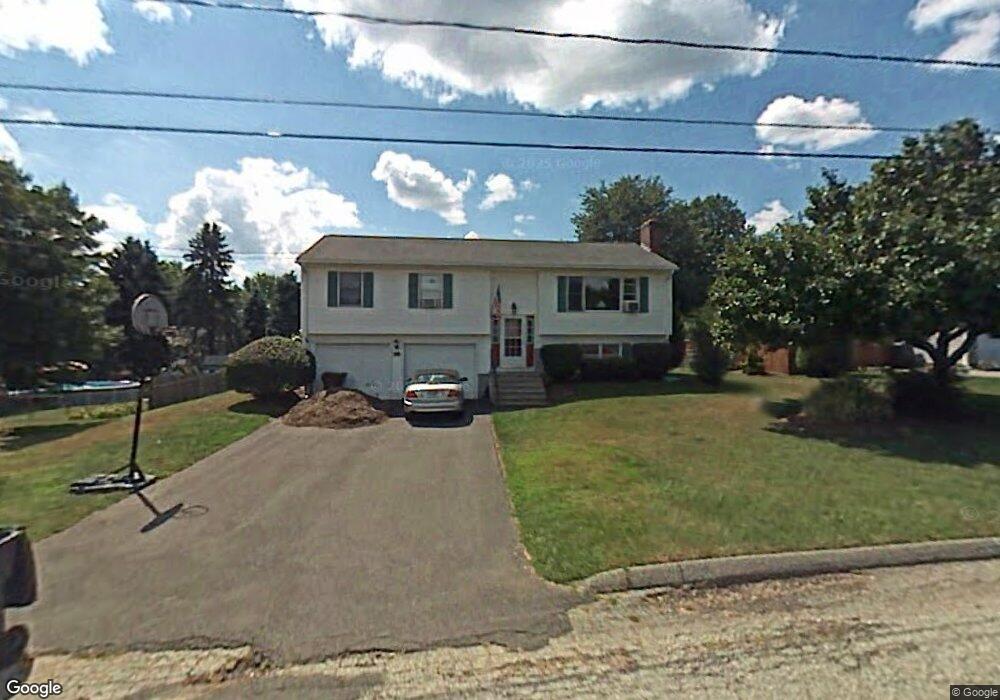
13 Teach St Enfield, CT 06082
Estimated Value: $361,171 - $389,000
3
Beds
3
Baths
1,190
Sq Ft
$318/Sq Ft
Est. Value
About This Home
This home is located at 13 Teach St, Enfield, CT 06082 and is currently estimated at $378,543, approximately $318 per square foot. 13 Teach St is a home located in Hartford County with nearby schools including Edgar H. Parkman School, Nathan Hale Elementary School, and John F. Kennedy Middle School.
Ownership History
Date
Name
Owned For
Owner Type
Purchase Details
Closed on
Jul 2, 2001
Sold by
Bratton Kenneth
Bought by
Koster Kevin and Koster Lynn
Current Estimated Value
Home Financials for this Owner
Home Financials are based on the most recent Mortgage that was taken out on this home.
Original Mortgage
$157,325
Interest Rate
7.14%
Purchase Details
Closed on
Mar 29, 1990
Sold by
Shepard Gilbert
Bought by
Pento Robert
Create a Home Valuation Report for This Property
The Home Valuation Report is an in-depth analysis detailing your home's value as well as a comparison with similar homes in the area
Home Values in the Area
Average Home Value in this Area
Purchase History
| Date | Buyer | Sale Price | Title Company |
|---|---|---|---|
| Koster Kevin | $163,500 | -- | |
| Pento Robert | $147,000 | -- |
Source: Public Records
Mortgage History
| Date | Status | Borrower | Loan Amount |
|---|---|---|---|
| Closed | Pento Robert | $152,500 | |
| Closed | Pento Robert | $156,000 | |
| Closed | Pento Robert | $157,325 | |
| Previous Owner | Pento Robert | $118,000 |
Source: Public Records
Tax History Compared to Growth
Tax History
| Year | Tax Paid | Tax Assessment Tax Assessment Total Assessment is a certain percentage of the fair market value that is determined by local assessors to be the total taxable value of land and additions on the property. | Land | Improvement |
|---|---|---|---|---|
| 2025 | $5,847 | $167,100 | $56,600 | $110,500 |
| 2024 | $5,690 | $167,100 | $56,600 | $110,500 |
| 2023 | $5,648 | $167,100 | $56,600 | $110,500 |
| 2022 | $5,128 | $167,100 | $56,600 | $110,500 |
| 2021 | $4,941 | $131,660 | $46,890 | $84,770 |
| 2020 | $4,941 | $131,660 | $46,890 | $84,770 |
| 2019 | $4,954 | $131,660 | $46,890 | $84,770 |
| 2018 | $4,871 | $131,660 | $46,890 | $84,770 |
| 2017 | $4,599 | $131,660 | $46,890 | $84,770 |
| 2016 | $4,492 | $130,930 | $46,890 | $84,040 |
| 2015 | $4,352 | $130,930 | $46,890 | $84,040 |
| 2014 | $4,240 | $130,930 | $46,890 | $84,040 |
Source: Public Records
Map
Nearby Homes