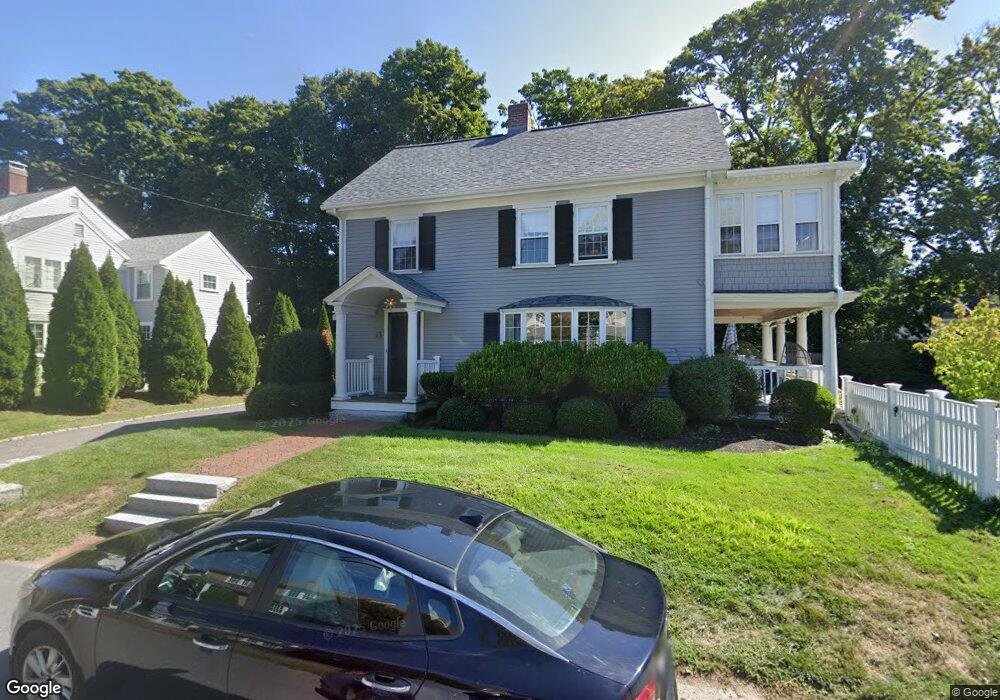
13 Thompson Ave Hingham, MA 02043
Estimated Value: $1,700,000 - $1,930,000
4
Beds
3
Baths
2,684
Sq Ft
$681/Sq Ft
Est. Value
About This Home
This home is located at 13 Thompson Ave, Hingham, MA 02043 and is currently estimated at $1,826,705, approximately $680 per square foot. 13 Thompson Ave is a home located in Plymouth County with nearby schools including East Elementary School, Hingham Middle School, and Hingham High School.
Ownership History
Date
Name
Owned For
Owner Type
Purchase Details
Closed on
Jun 7, 2011
Sold by
Flynn Michael J and Flynn Hillary D
Bought by
Paterniti Richard W and Paterniti Michelle D
Current Estimated Value
Home Financials for this Owner
Home Financials are based on the most recent Mortgage that was taken out on this home.
Original Mortgage
$523,750
Interest Rate
4.85%
Mortgage Type
Purchase Money Mortgage
Purchase Details
Closed on
Jul 23, 2007
Sold by
Flynn Mark T and Flynn Kelly M
Bought by
Flynn Michael J and Flynn Hillary D
Purchase Details
Closed on
Dec 30, 1998
Sold by
Watts Pamela M and Watts James J
Bought by
Flynn Kelly M and Flynn Mark T
Create a Home Valuation Report for This Property
The Home Valuation Report is an in-depth analysis detailing your home's value as well as a comparison with similar homes in the area
Purchase History
| Date | Buyer | Sale Price | Title Company |
|---|---|---|---|
| Paterniti Richard W | $1,055,000 | -- | |
| Flynn Michael J | $890,000 | -- | |
| Flynn Kelly M | $390,000 | -- |
Source: Public Records
Mortgage History
| Date | Status | Borrower | Loan Amount |
|---|---|---|---|
| Open | Flynn Kelly M | $523,000 | |
| Closed | Paterniti Richard W | $523,750 |
Source: Public Records
Tax History
| Year | Tax Paid | Tax Assessment Tax Assessment Total Assessment is a certain percentage of the fair market value that is determined by local assessors to be the total taxable value of land and additions on the property. | Land | Improvement |
|---|---|---|---|---|
| 2025 | $15,352 | $1,436,100 | $661,200 | $774,900 |
| 2024 | $14,868 | $1,370,300 | $661,200 | $709,100 |
| 2023 | $13,083 | $1,308,300 | $661,200 | $647,100 |
| 2022 | $12,588 | $1,088,900 | $570,000 | $518,900 |
| 2021 | $4,068 | $1,045,100 | $570,000 | $475,100 |
| 2020 | $12,050 | $1,045,100 | $570,000 | $475,100 |
| 2019 | $11,998 | $1,015,900 | $570,000 | $445,900 |
| 2018 | $127 | $969,000 | $570,000 | $399,000 |
| 2017 | $102 | $879,600 | $545,700 | $333,900 |
| 2016 | $10,661 | $853,600 | $519,700 | $333,900 |
| 2015 | $11,544 | $921,300 | $511,500 | $409,800 |
Source: Public Records
Map
Nearby Homes
Your Personal Tour Guide
Ask me questions while you tour the home.