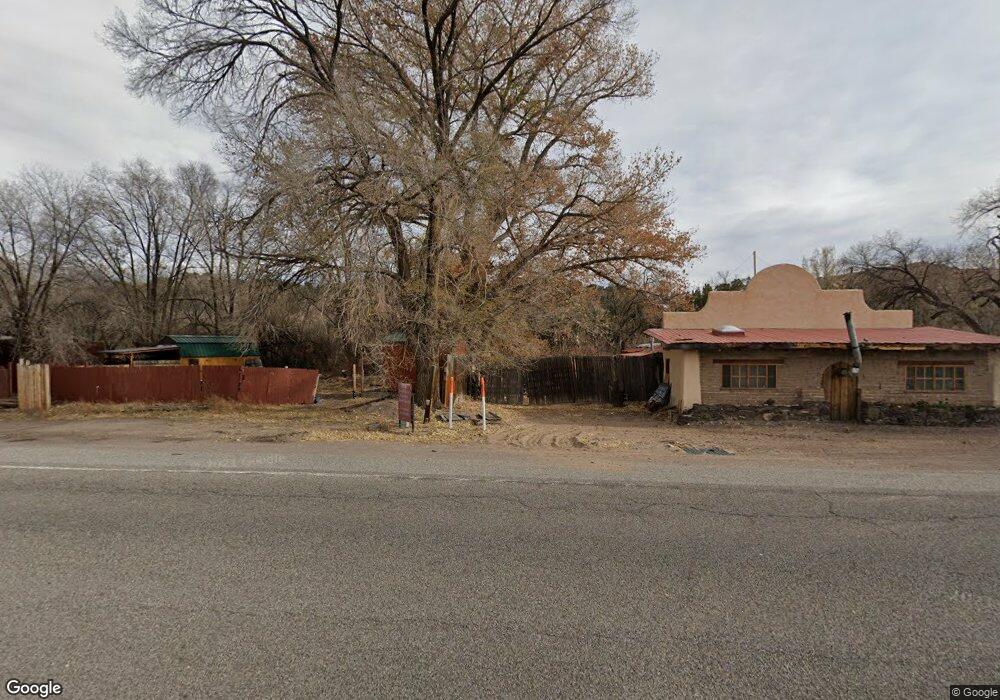
13 Thunder Rd Ojo Caliente, NM 87549
Estimated Value: $394,942 - $474,000
3
Beds
2
Baths
1,653
Sq Ft
$270/Sq Ft
Est. Value
About This Home
This home is located at 13 Thunder Rd, Ojo Caliente, NM 87549 and is currently estimated at $446,736, approximately $270 per square foot. 13 Thunder Rd is a home located in Rio Arriba County with nearby schools including Espanola Valley High School.
Ownership History
Date
Name
Owned For
Owner Type
Purchase Details
Closed on
Oct 27, 2021
Sold by
Salazar Isaac and Salazar Sophia
Bought by
Arguello Jamie John
Current Estimated Value
Home Financials for this Owner
Home Financials are based on the most recent Mortgage that was taken out on this home.
Original Mortgage
$284,747
Outstanding Balance
$260,226
Interest Rate
2.8%
Mortgage Type
Purchase Money Mortgage
Estimated Equity
$186,510
Purchase Details
Closed on
Feb 25, 2020
Sold by
Trujillo Reies A and Trujillo Anita R
Bought by
Salazar Sophia and Salazar Isaac
Home Financials for this Owner
Home Financials are based on the most recent Mortgage that was taken out on this home.
Original Mortgage
$165,000
Interest Rate
4%
Mortgage Type
New Conventional
Purchase Details
Closed on
Oct 20, 2017
Sold by
Trujillo Reies A
Bought by
Trujillo Reies A and Trujillo Anita R
Home Financials for this Owner
Home Financials are based on the most recent Mortgage that was taken out on this home.
Original Mortgage
$100,000
Interest Rate
3.78%
Mortgage Type
New Conventional
Create a Home Valuation Report for This Property
The Home Valuation Report is an in-depth analysis detailing your home's value as well as a comparison with similar homes in the area
Home Values in the Area
Average Home Value in this Area
Purchase History
| Date | Buyer | Sale Price | Title Company |
|---|---|---|---|
| Arguello Jamie John | -- | None Available | |
| Salazar Sophia | -- | None Available | |
| Trujillo Reies A | -- | None Available |
Source: Public Records
Mortgage History
| Date | Status | Borrower | Loan Amount |
|---|---|---|---|
| Open | Arguello Jamie John | $284,747 | |
| Previous Owner | Salazar Sophia | $165,000 | |
| Previous Owner | Trujillo Reies A | $100,000 |
Source: Public Records
Tax History Compared to Growth
Tax History
| Year | Tax Paid | Tax Assessment Tax Assessment Total Assessment is a certain percentage of the fair market value that is determined by local assessors to be the total taxable value of land and additions on the property. | Land | Improvement |
|---|---|---|---|---|
| 2024 | $1,163 | $47,045 | $11,359 | $35,686 |
| 2023 | $1,163 | $45,675 | $11,028 | $34,647 |
| 2022 | $1,085 | $44,346 | $10,708 | $33,638 |
| 2021 | $946 | $43,053 | $10,395 | $32,658 |
| 2020 | $926 | $41,799 | $10,092 | $31,707 |
| 2019 | $875 | $40,582 | $9,798 | $30,784 |
| 2018 | $776 | $40,117 | $9,333 | $30,784 |
| 2017 | $801 | $40,117 | $9,333 | $30,784 |
| 2016 | $882 | $41,423 | $9,716 | $31,707 |
| 2015 | $875 | $40,117 | $9,333 | $30,784 |
| 2014 | $855 | $40,397 | $9,613 | $30,784 |
| 2011 | -- | $12,647 | $0 | $0 |
Source: Public Records
Map
Nearby Homes
- 3 Cerrito de Baca
- 13 Cerrito de Baca
- 30 Cerro de Baca N
- 34600A Us Highway 285
- 11 N Cerrito
- TBD LOT 3 Juniper Rd
- 34358 Us Highway 285
- 00 Vacant Land
- 19995 U S 84
- 133 County Road 135
- 789 County Road 01
- 196 County Road 140 Unit B2
- 74 Tres Montes Rd
- 7 County Road 130a
- 62 Private Drive 1613a
- 91 Private Drive 1613b
- 53 Private Drive 1613b
- 6 Private Drive 1613b
- 4 Private Drive 1613b
- 42 Private Drive 1613b
- 13 Camino Fresca
- 15 Camino Fresca
- 9 Duende
- 7 Camino Fresca
- 10 Camino Fresca
- 18 Camino Fresca
- Tr D Lot 5A Duende
- 9 Camino Del Ojo
- 16 Camino Fresca
- 8 Camino Fresca
- HWY 285 West Park
- 20 Duende Dr
- 37 Hummingbird Ln
- 55 Rio Ojo Rd
- 120 Cedar Ridge Loop
- 21 Earth Ln
- 29 County Road 168
- 68 Cerrito de Baca Rd
- 19 Lava Rd
- 4 River Rd