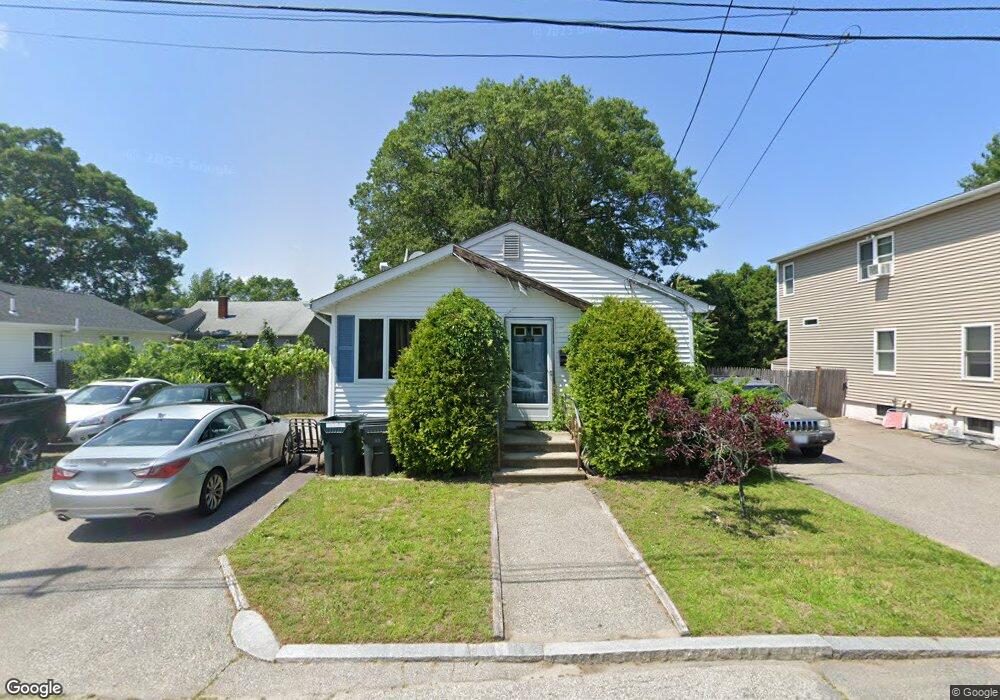
13 Udell St Providence, RI 02904
Charles NeighborhoodEstimated Value: $367,727 - $452,000
3
Beds
1
Bath
1,008
Sq Ft
$403/Sq Ft
Est. Value
About This Home
This home is located at 13 Udell St, Providence, RI 02904 and is currently estimated at $405,932, approximately $402 per square foot. 13 Udell St is a home located in Providence County with nearby schools including Times2 Elementary School, The San Miguel School, and Bishop Keough Regional High School.
Ownership History
Date
Name
Owned For
Owner Type
Purchase Details
Closed on
Apr 19, 2021
Sold by
Phalen Conor J and Munoz Stephanie L
Bought by
Rios Isidro D and Urizar Adelina U
Current Estimated Value
Home Financials for this Owner
Home Financials are based on the most recent Mortgage that was taken out on this home.
Original Mortgage
$242,500
Outstanding Balance
$217,997
Interest Rate
3%
Mortgage Type
Purchase Money Mortgage
Estimated Equity
$187,935
Purchase Details
Closed on
Jun 20, 1994
Sold by
Musumeci Thomas
Bought by
Morris Robert H and Morris Sandra
Home Financials for this Owner
Home Financials are based on the most recent Mortgage that was taken out on this home.
Original Mortgage
$92,150
Interest Rate
8.5%
Create a Home Valuation Report for This Property
The Home Valuation Report is an in-depth analysis detailing your home's value as well as a comparison with similar homes in the area
Home Values in the Area
Average Home Value in this Area
Purchase History
| Date | Buyer | Sale Price | Title Company |
|---|---|---|---|
| Rios Isidro D | $250,000 | None Available | |
| Rios Isidro D | $250,000 | None Available | |
| Morris Robert H | $92,000 | -- |
Source: Public Records
Mortgage History
| Date | Status | Borrower | Loan Amount |
|---|---|---|---|
| Open | Rios Isidro D | $242,500 | |
| Closed | Rios Isidro D | $242,500 | |
| Previous Owner | Morris Robert H | $30,000 | |
| Previous Owner | Morris Robert H | $10,000 | |
| Previous Owner | Morris Robert H | $92,150 |
Source: Public Records
Tax History
| Year | Tax Paid | Tax Assessment Tax Assessment Total Assessment is a certain percentage of the fair market value that is determined by local assessors to be the total taxable value of land and additions on the property. | Land | Improvement |
|---|---|---|---|---|
| 2025 | $2,849 | $339,200 | $128,000 | $211,200 |
| 2024 | $4,872 | $265,500 | $84,000 | $181,500 |
| 2023 | $4,872 | $265,500 | $84,000 | $181,500 |
| 2022 | $4,726 | $265,500 | $84,000 | $181,500 |
| 2021 | $4,499 | $183,200 | $61,000 | $122,200 |
| 2020 | $4,499 | $183,200 | $61,000 | $122,200 |
| 2019 | $4,499 | $183,200 | $61,000 | $122,200 |
| 2018 | $3,995 | $125,000 | $47,100 | $77,900 |
| 2017 | $3,995 | $125,000 | $47,100 | $77,900 |
| 2016 | $3,995 | $125,000 | $47,100 | $77,900 |
| 2015 | $3,830 | $115,700 | $47,700 | $68,000 |
| 2014 | $3,905 | $115,700 | $47,700 | $68,000 |
| 2013 | $3,905 | $115,700 | $47,700 | $68,000 |
Source: Public Records
Map
Nearby Homes
- 3 Victor Emanuel Ave
- 10 Josephine St Unit 310
- 862 Charles St
- 20 Hurdis St Unit 1
- 120 Woodward Rd
- 37 Washington St
- 19 Benedict St
- 31 Washington St
- 93 Paul St
- 1002 Charles St
- 19 Washington St
- 112 Hugo St
- 0 Piave St
- 136 Windmill St
- 62 Russo St
- 559 Branch Ave
- 119 Edgeworth Ave
- 31 Vandewater St
- 40 Wilna St
- 5 Morrill Ln Unit C
Your Personal Tour Guide
Ask me questions while you tour the home.