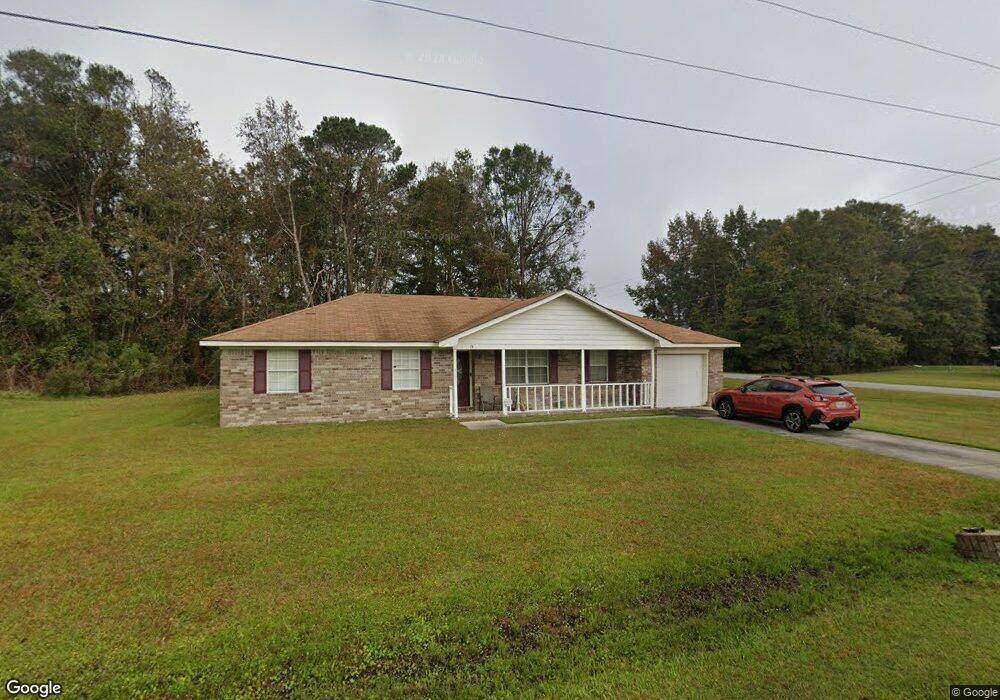
13 W Red Fox Ct Midway, GA 31320
Estimated Value: $227,000 - $267,000
3
Beds
2
Baths
1,338
Sq Ft
$183/Sq Ft
Est. Value
About This Home
This home is located at 13 W Red Fox Ct, Midway, GA 31320 and is currently estimated at $244,194, approximately $182 per square foot. 13 W Red Fox Ct is a home with nearby schools including Liberty Elementary School, Midway Middle School, and Liberty County High School.
Ownership History
Date
Name
Owned For
Owner Type
Purchase Details
Closed on
Oct 18, 2006
Sold by
Stevens Gloria A
Bought by
Houston Willlie Lee and Houston Gloria Ann
Current Estimated Value
Home Financials for this Owner
Home Financials are based on the most recent Mortgage that was taken out on this home.
Original Mortgage
$87,750
Outstanding Balance
$51,927
Interest Rate
6.31%
Mortgage Type
New Conventional
Estimated Equity
$192,267
Purchase Details
Closed on
Jul 23, 2002
Sold by
Sec Of V A
Bought by
Stevens Gloria A
Purchase Details
Closed on
Oct 29, 2001
Sold by
Canaday Kenneth A
Bought by
Sec Of V A
Purchase Details
Closed on
Oct 2, 2001
Sold by
Canaday Kenneth A
Bought by
Ctit Mortgage Inc
Purchase Details
Closed on
Jan 21, 1997
Sold by
Holland Homes Inc
Bought by
Canaday Kenneth A
Purchase Details
Closed on
May 15, 1996
Bought by
Holland Homes
Purchase Details
Closed on
Jun 13, 1995
Bought by
Dykes Lenard
Create a Home Valuation Report for This Property
The Home Valuation Report is an in-depth analysis detailing your home's value as well as a comparison with similar homes in the area
Home Values in the Area
Average Home Value in this Area
Purchase History
| Date | Buyer | Sale Price | Title Company |
|---|---|---|---|
| Houston Willlie Lee | -- | -- | |
| Stevens Gloria A | $73,500 | -- | |
| Sec Of V A | -- | -- | |
| Ctit Mortgage Inc | -- | -- | |
| Canaday Kenneth A | $75,500 | -- | |
| Holland Homes Inc | -- | -- | |
| Holland Homes | $10,500 | -- | |
| Dykes Lenard | -- | -- |
Source: Public Records
Mortgage History
| Date | Status | Borrower | Loan Amount |
|---|---|---|---|
| Open | Houston Willlie Lee | $87,750 |
Source: Public Records
Tax History Compared to Growth
Tax History
| Year | Tax Paid | Tax Assessment Tax Assessment Total Assessment is a certain percentage of the fair market value that is determined by local assessors to be the total taxable value of land and additions on the property. | Land | Improvement |
|---|---|---|---|---|
| 2024 | $1,434 | $68,952 | $14,000 | $54,952 |
| 2023 | $1,434 | $60,540 | $12,000 | $48,540 |
| 2022 | $1,644 | $46,406 | $10,800 | $35,606 |
| 2021 | $1,503 | $42,888 | $10,800 | $32,088 |
| 2020 | $1,522 | $43,295 | $10,800 | $32,495 |
| 2019 | $1,346 | $39,611 | $10,000 | $29,611 |
| 2018 | $1,343 | $39,976 | $10,000 | $29,976 |
| 2017 | $1,627 | $38,342 | $8,000 | $30,342 |
| 2016 | $1,210 | $38,708 | $8,000 | $30,708 |
| 2015 | $1,473 | $38,708 | $8,000 | $30,708 |
| 2014 | $1,473 | $45,894 | $10,000 | $35,894 |
| 2013 | -- | $43,333 | $10,000 | $33,333 |
Source: Public Records
Map
Nearby Homes
- 296 River Bend Dr
- 327 River Bend Dr
- 364 River Bend Dr
- 8701 E Oglethorpe Hwy
- 0 E Oglethorpe Unit SA341930
- 0 E Oglethorpe Unit 153327
- 0 E Oglethorpe Unit 10592168
- 90 Charleston Ct
- 0000 E Oglethorpe Hwy
- 182 Gloucester Dr
- 0 S Coastal Hwy
- 29 Sassafras Ln
- 2 Acres Walthour Rd
- 670 Stone Ct
- 35 Hollis Ln
- 152 Holland Dr
- 1019 Stone Ct
- 94 Buckingham Dr
- 1099 Stone Ct
- 1057 Stone Ct
- 35 W Red Fox Ct
- 14 W Red Fox Ct
- 12 E Red Fox Ct
- 14 W Beaver Ln
- 34 W Red Fox Ct
- 34 W Beaver Ln
- 11 E Red Fox Ct
- 59 W Red Fox Ct
- 11 E Beaver Ln
- 48 W Beaver Ln
- 34 E Red Fox Ct
- 60 W Red Fox Ct
- 33 E Red Fox Ct
- 33 E Beaver Ln
- 73 W Red Fox Ct
- 13 W Beaver Ln
- 60 W Beaver Ln
- E E Beaver Ln
- 35 W Beaver Ln
- 74 W Red Fox Ct