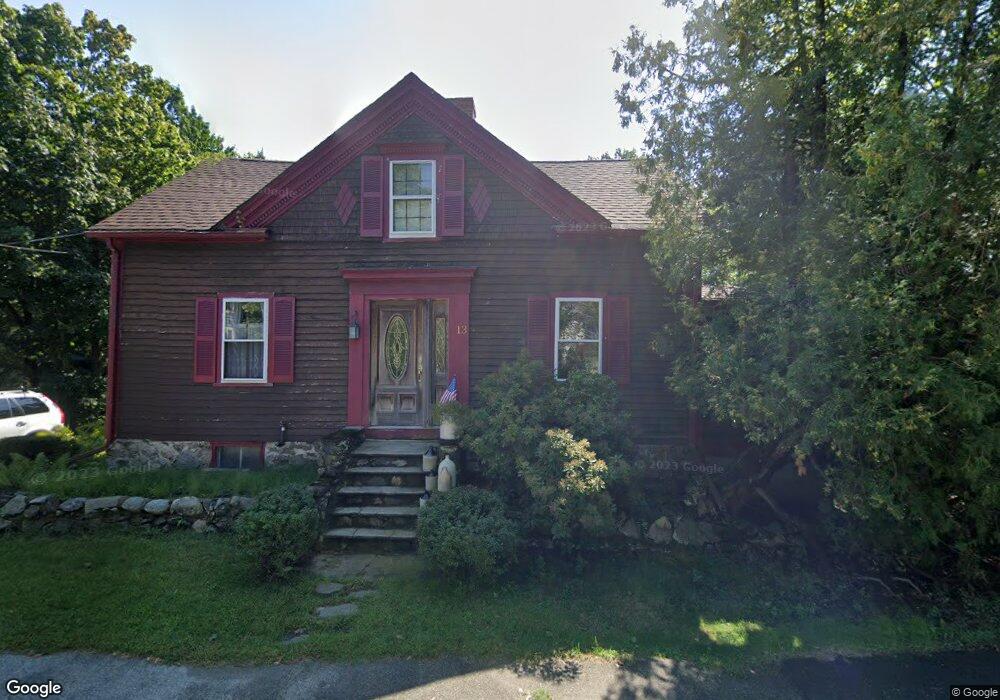
13 Wenham St Danvers, MA 01923
Estimated Value: $548,000 - $726,000
3
Beds
1
Bath
1,620
Sq Ft
$398/Sq Ft
Est. Value
About This Home
This home is located at 13 Wenham St, Danvers, MA 01923 and is currently estimated at $644,559, approximately $397 per square foot. 13 Wenham St is a home located in Essex County with nearby schools including St. Mary of the Annunciation School and St. John's Prep.
Ownership History
Date
Name
Owned For
Owner Type
Purchase Details
Closed on
May 28, 2009
Sold by
Wrigley Michael F
Bought by
Mouhtouris Nicole P
Current Estimated Value
Home Financials for this Owner
Home Financials are based on the most recent Mortgage that was taken out on this home.
Original Mortgage
$50,000
Outstanding Balance
$31,761
Interest Rate
4.87%
Mortgage Type
Purchase Money Mortgage
Estimated Equity
$612,798
Purchase Details
Closed on
Jun 27, 2007
Sold by
Mouhtouris James F and Mouhtouris Susan R
Bought by
Mouohtouris James F
Create a Home Valuation Report for This Property
The Home Valuation Report is an in-depth analysis detailing your home's value as well as a comparison with similar homes in the area
Home Values in the Area
Average Home Value in this Area
Purchase History
| Date | Buyer | Sale Price | Title Company |
|---|---|---|---|
| Mouhtouris Nicole P | $28,500 | -- | |
| Mouhtouris Nicole P | $128,250 | -- | |
| Mouhtouris Nicole P | -- | -- | |
| Mouohtouris James F | -- | -- |
Source: Public Records
Mortgage History
| Date | Status | Borrower | Loan Amount |
|---|---|---|---|
| Open | Mouohtouris James F | $50,000 | |
| Previous Owner | Mouohtouris James F | $21,063 | |
| Previous Owner | Mouohtouris James F | $60,000 |
Source: Public Records
Tax History Compared to Growth
Tax History
| Year | Tax Paid | Tax Assessment Tax Assessment Total Assessment is a certain percentage of the fair market value that is determined by local assessors to be the total taxable value of land and additions on the property. | Land | Improvement |
|---|---|---|---|---|
| 2025 | $6,110 | $556,000 | $337,800 | $218,200 |
| 2024 | $6,113 | $550,200 | $337,800 | $212,400 |
| 2023 | $5,857 | $498,500 | $299,600 | $198,900 |
| 2022 | $5,619 | $443,800 | $261,300 | $182,500 |
| 2021 | $5,263 | $394,200 | $237,100 | $157,100 |
| 2020 | $5,289 | $405,000 | $229,400 | $175,600 |
| 2019 | $5,344 | $402,400 | $221,800 | $180,600 |
| 2018 | $5,053 | $373,200 | $215,400 | $157,800 |
| 2017 | $4,985 | $351,300 | $200,100 | $151,200 |
| 2016 | $4,791 | $337,400 | $191,200 | $146,200 |
| 2015 | $4,458 | $299,000 | $165,700 | $133,300 |
Source: Public Records
Map
Nearby Homes