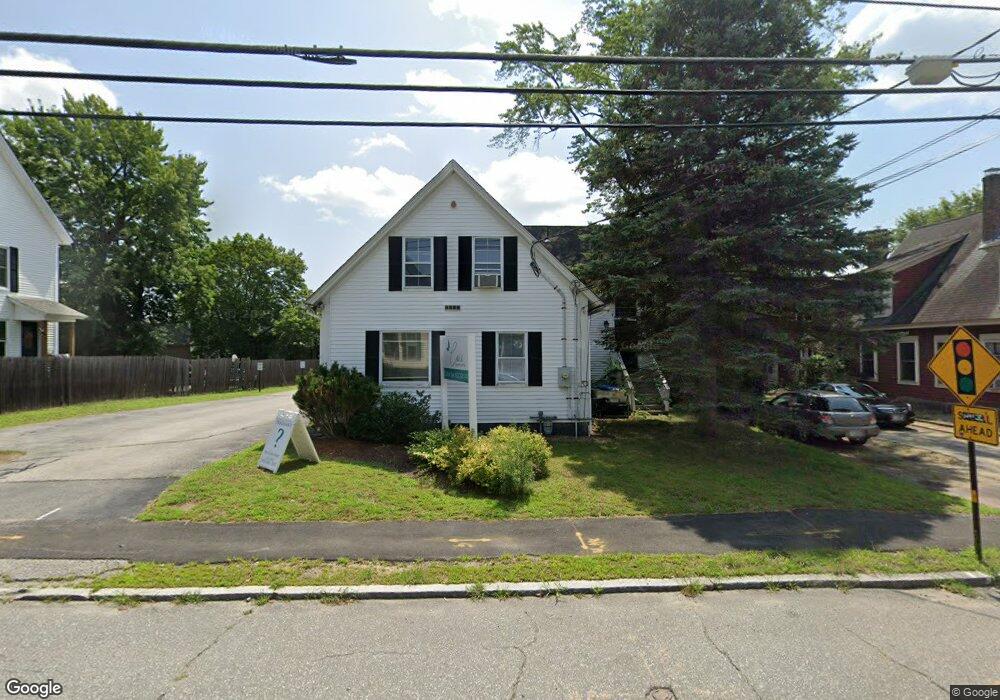
13 West St Concord, NH 03301
South End NeighborhoodEstimated Value: $608,482
Studio
2
Baths
3,579
Sq Ft
$170/Sq Ft
Est. Value
About This Home
This home is located at 13 West St, Concord, NH 03301 and is currently estimated at $608,482, approximately $170 per square foot. 13 West St is a home located in Merrimack County with nearby schools including Abbot-Downing School, Rundlett Middle School, and Concord High School.
Ownership History
Date
Name
Owned For
Owner Type
Purchase Details
Closed on
Sep 27, 2018
Sold by
Emet Properties Llc
Bought by
Cen Care Net Pregnancy
Current Estimated Value
Home Financials for this Owner
Home Financials are based on the most recent Mortgage that was taken out on this home.
Original Mortgage
$263,200
Outstanding Balance
$227,144
Interest Rate
4.5%
Mortgage Type
New Conventional
Estimated Equity
$381,338
Purchase Details
Closed on
Dec 22, 2015
Sold by
Manchester Sand Gravel
Bought by
Greenways Bear Paw Reg
Purchase Details
Closed on
Jul 2, 2008
Sold by
Nh Motor Transport Ass
Bought by
Emet Properties Llc
Purchase Details
Closed on
Oct 17, 1997
Sold by
Victorian Assoc Of Con
Bought by
Nh Motor Transport Ass
Home Financials for this Owner
Home Financials are based on the most recent Mortgage that was taken out on this home.
Original Mortgage
$175,000
Interest Rate
7.46%
Mortgage Type
Commercial
Create a Home Valuation Report for This Property
The Home Valuation Report is an in-depth analysis detailing your home's value as well as a comparison with similar homes in the area
Home Values in the Area
Average Home Value in this Area
Purchase History
| Date | Buyer | Sale Price | Title Company |
|---|---|---|---|
| Cen Care Net Pregnancy | $329,000 | -- | |
| Greenways Bear Paw Reg | -- | -- | |
| Emet Properties Llc | $310,000 | -- | |
| Nh Motor Transport Ass | $150,000 | -- |
Source: Public Records
Mortgage History
| Date | Status | Borrower | Loan Amount |
|---|---|---|---|
| Open | Cen Care Net Pregnancy | $263,200 | |
| Previous Owner | Nh Motor Transport Ass | $220,000 | |
| Previous Owner | Nh Motor Transport Ass | $175,000 |
Source: Public Records
Tax History
| Year | Tax Paid | Tax Assessment Tax Assessment Total Assessment is a certain percentage of the fair market value that is determined by local assessors to be the total taxable value of land and additions on the property. | Land | Improvement |
|---|---|---|---|---|
| 2025 | $0 | $351,000 | $103,600 | $247,400 |
| 2024 | $0 | $351,000 | $103,600 | $247,400 |
| 2023 | $8,979 | $351,000 | $103,600 | $247,400 |
| 2022 | $0 | $351,000 | $103,600 | $247,400 |
| 2021 | $8,979 | $351,000 | $103,600 | $247,400 |
| 2020 | $8,979 | $261,800 | $76,600 | $185,200 |
| 2019 | $8,979 | $261,800 | $76,600 | $185,200 |
| 2018 | $8,979 | $318,500 | $103,600 | $214,900 |
| 2017 | $7,955 | $281,700 | $86,100 | $195,600 |
| 2016 | $8,547 | $308,900 | $133,000 | $175,900 |
| 2015 | $8,883 | $324,900 | $133,000 | $191,900 |
| 2014 | $8,711 | $324,900 | $133,000 | $191,900 |
| 2013 | -- | $324,900 | $133,000 | $191,900 |
| 2012 | -- | $324,900 | $133,000 | $191,900 |
Source: Public Records
Map
Nearby Homes
- 111 -113 South Main St
- 273-279 S Main St
- 58 S State St
- 47 South St
- 32 Stone St
- 2 S Spring St
- 335 S Main St
- 20 Cypress St
- 0 South St Unit 4969509
- 16 Prince St
- 55 Centre St
- 22 Fairfield Dr
- 21 Fairfield Dr
- 20 Fairfield Dr
- 30 Longmeadow Dr
- 11 Fellows St
- 33 Joffre St
- 10 Ridge Rd
- 40 Nivelle St
- 9 Forest St
Your Personal Tour Guide
Ask me questions while you tour the home.