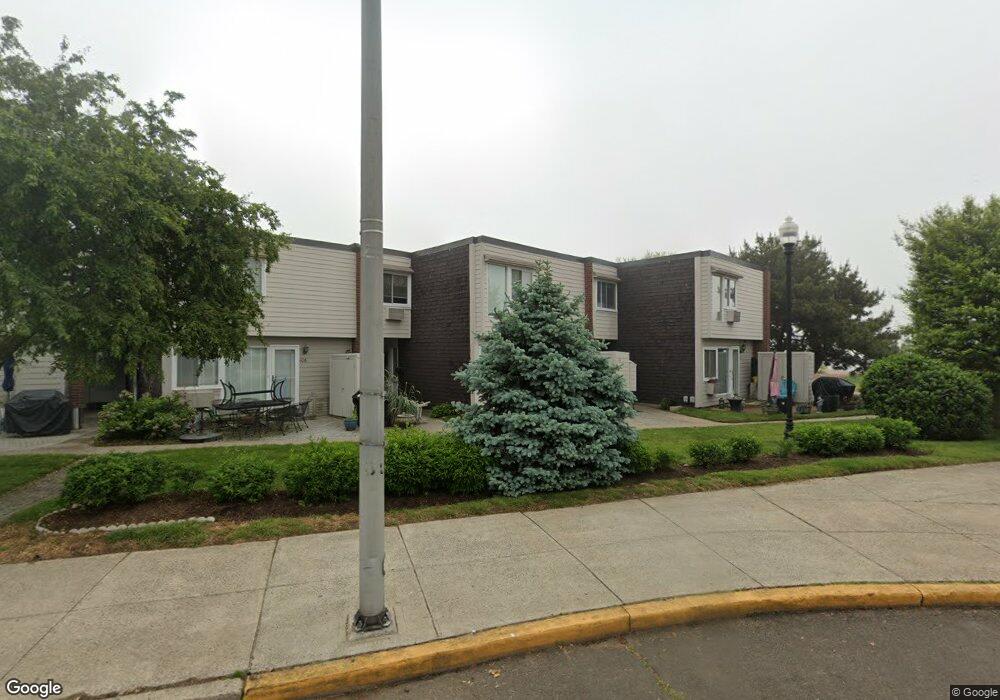
13 West Walk West Haven, CT 06516
West Haven Center NeighborhoodEstimated Value: $303,921 - $320,000
2
Beds
2
Baths
1,174
Sq Ft
$266/Sq Ft
Est. Value
About This Home
This home is located at 13 West Walk, West Haven, CT 06516 and is currently estimated at $311,980, approximately $265 per square foot. 13 West Walk is a home located in New Haven County with nearby schools including Carrigan 5/6 Intermediate School, Harry M. Bailey Middle School, and West Haven High School.
Ownership History
Date
Name
Owned For
Owner Type
Purchase Details
Closed on
May 3, 2002
Sold by
Keegan Randy P
Bought by
Wilmot Geri and Wilmot Charles
Current Estimated Value
Purchase Details
Closed on
Jun 9, 1999
Sold by
Mcvicker John J
Bought by
Keegan Randy
Home Financials for this Owner
Home Financials are based on the most recent Mortgage that was taken out on this home.
Original Mortgage
$83,420
Interest Rate
6.9%
Purchase Details
Closed on
Aug 28, 1991
Sold by
Long Richard P
Bought by
Mcvicker John J
Home Financials for this Owner
Home Financials are based on the most recent Mortgage that was taken out on this home.
Original Mortgage
$107,150
Interest Rate
9.44%
Mortgage Type
Unknown
Create a Home Valuation Report for This Property
The Home Valuation Report is an in-depth analysis detailing your home's value as well as a comparison with similar homes in the area
Home Values in the Area
Average Home Value in this Area
Purchase History
| Date | Buyer | Sale Price | Title Company |
|---|---|---|---|
| Wilmot Geri | $144,300 | -- | |
| Keegan Randy | $86,000 | -- | |
| Mcvicker John J | $111,000 | -- |
Source: Public Records
Mortgage History
| Date | Status | Borrower | Loan Amount |
|---|---|---|---|
| Previous Owner | Mcvicker John J | $100,500 | |
| Previous Owner | Mcvicker John J | $83,420 | |
| Previous Owner | Mcvicker John J | $107,150 | |
| Previous Owner | Mcvicker John J | $60,000 |
Source: Public Records
Tax History Compared to Growth
Tax History
| Year | Tax Paid | Tax Assessment Tax Assessment Total Assessment is a certain percentage of the fair market value that is determined by local assessors to be the total taxable value of land and additions on the property. | Land | Improvement |
|---|---|---|---|---|
| 2025 | $6,635 | $192,150 | $0 | $192,150 |
| 2024 | $4,490 | $92,540 | $0 | $92,540 |
| 2023 | $4,304 | $92,540 | $0 | $92,540 |
| 2022 | $4,220 | $92,540 | $0 | $92,540 |
| 2021 | $4,220 | $92,540 | $0 | $92,540 |
| 2020 | $5,066 | $100,380 | $0 | $100,380 |
| 2019 | $4,885 | $100,380 | $0 | $100,380 |
| 2018 | $4,843 | $100,380 | $0 | $100,380 |
| 2017 | $4,583 | $100,380 | $0 | $100,380 |
| 2016 | $4,573 | $100,380 | $0 | $100,380 |
| 2015 | $5,389 | $133,560 | $0 | $133,560 |
| 2014 | $5,356 | $133,560 | $0 | $133,560 |
Source: Public Records
Map
Nearby Homes
- 31 West Walk Unit 31
- 65 West Walk
- 204 West Walk Unit 204
- 140 Captain Thomas Blvd Unit 302
- 189 Park St
- 94 Thomas St
- 1 Peck Ave Unit 11
- 314 Park St
- 12 East Ave
- 248 William St
- 34 Thomas St
- 202 Campbell Ave
- 88 William St
- 225 Beach St Unit 2H
- 159 Leete St
- 72 Atwater St
- 481 Savin Ave
- 90 Blohm St
- 341 Peck Ave
- 102 Brown St