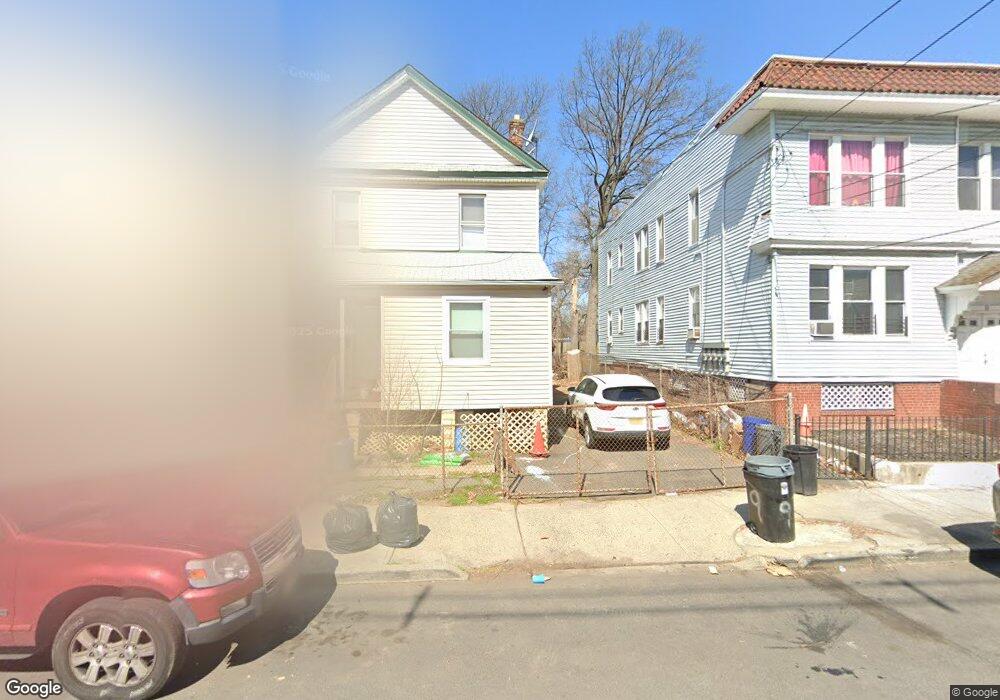
13 Willoughby St Unit 2 Newark, NJ 07112
Weequahic NeighborhoodEstimated Value: $512,000 - $641,000
3
Beds
1
Bath
2,264
Sq Ft
$256/Sq Ft
Est. Value
About This Home
This home is located at 13 Willoughby St Unit 2, Newark, NJ 07112 and is currently estimated at $580,367, approximately $256 per square foot. 13 Willoughby St Unit 2 is a home located in Essex County with nearby schools including Hawthorne Avenue Elementary School, Chancellor Avenue School, and Peshine Avenue Elementary School.
Ownership History
Date
Name
Owned For
Owner Type
Purchase Details
Closed on
Dec 12, 2019
Sold by
Cheng Hoi C
Bought by
Pauta Julio
Current Estimated Value
Purchase Details
Closed on
Mar 25, 2015
Sold by
Spira Moshe
Bought by
Niazi Llc
Purchase Details
Closed on
Jun 4, 2007
Sold by
Spira Moshe and Landau Ichok
Bought by
Spira Moshe
Purchase Details
Closed on
Apr 17, 2002
Sold by
Austin Capital Inc
Bought by
Burke Rose
Home Financials for this Owner
Home Financials are based on the most recent Mortgage that was taken out on this home.
Original Mortgage
$133,000
Interest Rate
6.9%
Create a Home Valuation Report for This Property
The Home Valuation Report is an in-depth analysis detailing your home's value as well as a comparison with similar homes in the area
Home Values in the Area
Average Home Value in this Area
Purchase History
| Date | Buyer | Sale Price | Title Company |
|---|---|---|---|
| Pauta Julio | $255,000 | Old Republic Title | |
| Niazi Llc | $55,000 | -- | |
| Spira Moshe | -- | Multiple | |
| Burke Rose | $140,000 | -- |
Source: Public Records
Mortgage History
| Date | Status | Borrower | Loan Amount |
|---|---|---|---|
| Previous Owner | Burke Rose | $133,000 |
Source: Public Records
Tax History
| Year | Tax Paid | Tax Assessment Tax Assessment Total Assessment is a certain percentage of the fair market value that is determined by local assessors to be the total taxable value of land and additions on the property. | Land | Improvement |
|---|---|---|---|---|
| 2025 | $8,313 | $223,000 | $29,000 | $194,000 |
| 2024 | $8,313 | $223,000 | $29,000 | $194,000 |
| 2022 | $8,331 | $223,000 | $29,000 | $194,000 |
| 2021 | $8,327 | $223,000 | $29,000 | $194,000 |
| 2020 | $5,445 | $143,300 | $29,000 | $114,300 |
| 2019 | $5,390 | $143,300 | $29,000 | $114,300 |
| 2018 | $5,292 | $143,300 | $29,000 | $114,300 |
| 2017 | $5,101 | $143,300 | $29,000 | $114,300 |
| 2016 | $4,930 | $143,300 | $29,000 | $114,300 |
| 2015 | $4,742 | $143,300 | $29,000 | $114,300 |
| 2014 | $4,444 | $143,300 | $29,000 | $114,300 |
Source: Public Records
Map
Nearby Homes
- 20 Willoughby St
- 24 Willoughby St Unit 26
- 24-26 Willoughby St
- 47 Aldine St
- 53 Aldine St
- 54-56 Bragaw Ave
- 219-221 Clinton Place
- 134 Dewey St
- 209-211 Clinton Place
- 129 Dewey St
- 218-220 Clinton Place
- 127 Dewey St Unit 129
- 307 Clinton Place
- 81 Wolcott Terrace
- 148 Dewey St
- 72-74 Willoughby St
- 72-74 Willoughby St Unit 2
- 167 Goodwin Ave
- 78 Willoughby St
- 51 Demarest St
- 13-15 Willoughby St
- 13 Willoughby St Unit 15
- 17 Willoughby St
- 9 Willoughby St Unit 11
- 9-11 Edwin Place
- 11 Edwin Place Unit A
- 9 Edwin Place
- 21 Willoughby St Unit B7
- 21 Willoughby St Unit C8
- 21 Willoughby St Unit B8
- 21 Willoughby St Unit B2
- 21 Willoughby St Unit A4
- 21 Willoughby St
- 21-25-25 Willoughby St Unit B4
- 13 Edwin Place
- 13 Edwin Place Unit 1
- 13 Edwin Place Unit 2
- 20 1/2 Willoughby St
- 42 Bragaw Ave Unit 2
- 7 Willoughby St Unit 2
Your Personal Tour Guide
Ask me questions while you tour the home.