13 Worcester Ave Hudson, MA 01749
Lake Boon NeighborhoodEstimated Value: $590,880 - $835,000
2
Beds
1
Bath
1,419
Sq Ft
$471/Sq Ft
Est. Value
About This Home
This home is located at 13 Worcester Ave, Hudson, MA 01749 and is currently estimated at $668,220, approximately $470 per square foot. 13 Worcester Ave is a home located in Middlesex County with nearby schools including David J. Quinn Middle School and Hudson High School.
Ownership History
Date
Name
Owned For
Owner Type
Purchase Details
Closed on
Dec 14, 2017
Sold by
Fas Rt
Bought by
Krongard David W and Conroy Kristin A
Current Estimated Value
Home Financials for this Owner
Home Financials are based on the most recent Mortgage that was taken out on this home.
Original Mortgage
$450,000
Outstanding Balance
$382,441
Interest Rate
3.94%
Mortgage Type
New Conventional
Estimated Equity
$285,779
Purchase Details
Closed on
Oct 16, 2009
Sold by
Smith
Bought by
Smith Frank A
Purchase Details
Closed on
Sep 16, 2003
Sold by
Smith Ruth E and Smith Frank A
Bought by
Trs Ruth E Smith and Trs Frank A
Purchase Details
Closed on
Oct 18, 1984
Bought by
F & R Rt
Create a Home Valuation Report for This Property
The Home Valuation Report is an in-depth analysis detailing your home's value as well as a comparison with similar homes in the area
Home Values in the Area
Average Home Value in this Area
Purchase History
| Date | Buyer | Sale Price | Title Company |
|---|---|---|---|
| Krongard David W | -- | -- | |
| Krongard David W | -- | -- | |
| Krongard David W | $500,000 | -- | |
| Krongard David W | $500,000 | -- | |
| Smith Frank A | -- | -- | |
| Smith Frank A | -- | -- | |
| Trs Ruth E Smith | -- | -- | |
| Trs Ruth E Smith | -- | -- | |
| F & R Rt | -- | -- | |
| F & R Rt | -- | -- |
Source: Public Records
Mortgage History
| Date | Status | Borrower | Loan Amount |
|---|---|---|---|
| Open | Krongard David W | $450,000 | |
| Closed | Krongard David W | $450,000 | |
| Previous Owner | F & R Rt | $85,000 |
Source: Public Records
Tax History
| Year | Tax Paid | Tax Assessment Tax Assessment Total Assessment is a certain percentage of the fair market value that is determined by local assessors to be the total taxable value of land and additions on the property. | Land | Improvement |
|---|---|---|---|---|
| 2025 | $8,696 | $626,500 | $364,500 | $262,000 |
| 2024 | $8,035 | $573,900 | $324,300 | $249,600 |
| 2023 | $7,845 | $537,300 | $312,000 | $225,300 |
| 2022 | $7,332 | $462,300 | $283,500 | $178,800 |
| 2021 | $10,682 | $643,900 | $270,200 | $373,700 |
| 2020 | $10,297 | $619,900 | $264,800 | $355,100 |
| 2019 | $10,090 | $592,500 | $264,800 | $327,700 |
| 2018 | $9,328 | $548,100 | $252,200 | $295,900 |
| 2017 | $8,915 | $509,400 | $240,200 | $269,200 |
| 2016 | $7,661 | $443,100 | $193,200 | $249,900 |
| 2015 | $7,096 | $410,900 | $193,200 | $217,700 |
| 2014 | $6,881 | $395,000 | $169,500 | $225,500 |
Source: Public Records
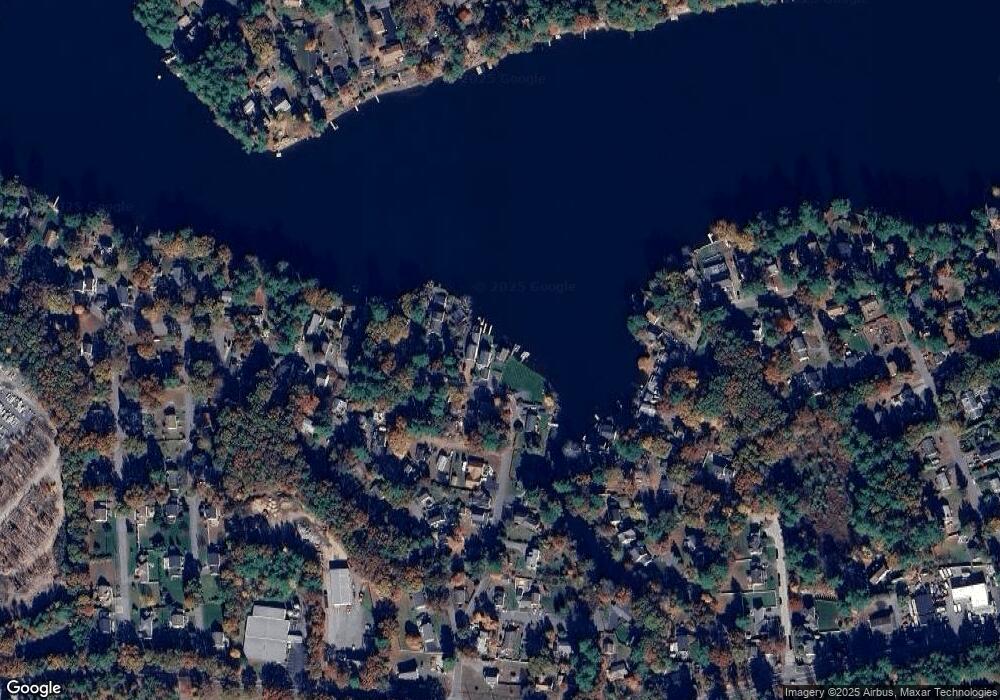
Map
Nearby Homes
- 210 Barton Rd
- 8 Town Line Rd Unit 4
- 1 Town Line Rd
- 1 Town Line Rd Unit 18
- 10 Old County Rd Unit 19
- 51 Hale Rd
- 3 Shore Line Dr Unit 15
- 5 Shore Line Rd
- 14 Old County Rd Unit 21
- 34 Hallock Point Rd
- 8 Shoreline Dr Unit 11
- 786 Main St
- 22 Barracks Rd Unit 22
- 168 Blanchette Dr
- 9 & 9A Abigail
- 11 Great Lake Dr
- 1 Glendale Rd
- 40 Saw Mill Rd
- 84 Crosby Rd
- 7 Old North Rd
- 5 Worcester Ave
- 7 Worcester Ave
- 2 Worcester Ave
- 33 Temple Ave
- 9 Worcester Ave Unit 9B
- 9 Worcester Ave Unit 9
- 9 Worcester Ave Unit 9A
- 9b Worcester Ave
- 9 A Worcester Ave Unit 9A
- 33 Worcester Ave
- 10 & 10a Worcester Ave
- 10 Worcester Ave
- 15 Worcester Ave
- 16 Temple Ave
- 17 Temple Ave
- 18 Temple Ave
- 23 Worcester Ave
- 20 Temple Ave
- 16 Lakeside Ave
- 20 Lakeside Ave
Your Personal Tour Guide
Ask me questions while you tour the home.