Estimated Value: $69,000 - $123,718
3
Beds
1
Bath
900
Sq Ft
$112/Sq Ft
Est. Value
About This Home
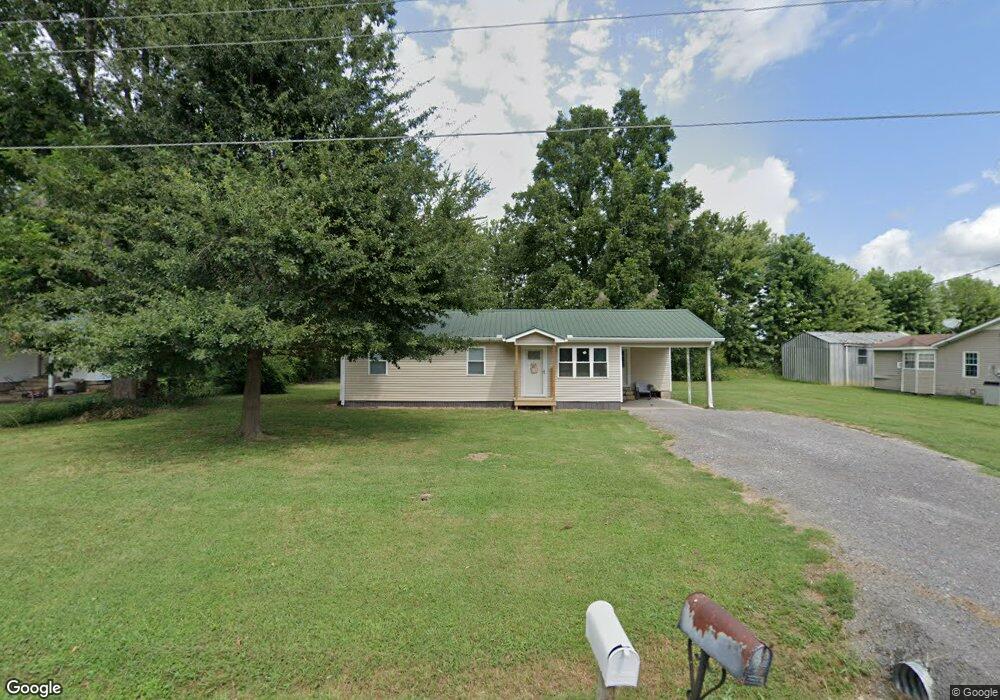
This home is located at 130 Baker St, Gates, TN 38037 and is currently estimated at $100,930, approximately $112 per square foot. 130 Baker St is a home located in Lauderdale County with nearby schools including Halls Elementary School, Halls Junior High School, and Halls High School.
Ownership History
Date
Name
Owned For
Owner Type
Purchase Details
Closed on
Nov 26, 2002
Sold by
Housing And Urban Developm
Bought by
Moore James L
Current Estimated Value
Purchase Details
Closed on
Feb 22, 2002
Sold by
Tennessee Housing Developm
Bought by
Housing & Urban Developmen
Purchase Details
Closed on
Feb 15, 2002
Bought by
Sec Of Housing & Urban Dev %Golden Feather Re
Purchase Details
Closed on
May 20, 1996
Sold by
Burnie Norman and Burnie Cherry
Bought by
Hill Freddie J and Hill Frances C
Purchase Details
Closed on
Apr 5, 1993
Bought by
Norman Burnie and Cherry Charles S
Purchase Details
Closed on
Feb 22, 1991
Bought by
Farmers Union Bank
Purchase Details
Closed on
Mar 19, 1988
Bought by
King Harry Lee
Purchase Details
Closed on
May 7, 1987
Bought by
Wells Jo Ann
Purchase Details
Closed on
Dec 16, 1978
Bought by
Anderson Stanley R
Purchase Details
Closed on
Jul 5, 1976
Create a Home Valuation Report for This Property
The Home Valuation Report is an in-depth analysis detailing your home's value as well as a comparison with similar homes in the area
Purchase History
| Date | Buyer | Sale Price | Title Company |
|---|---|---|---|
| Moore James L | $22,500 | -- | |
| Housing & Urban Developmen | $41,763 | -- | |
| Sec Of Housing & Urban Dev %Golden Feather Re | $41,800 | -- | |
| Hill Freddie J | $38,500 | -- | |
| Norman Burnie | $13,500 | -- | |
| Farmers Union Bank | -- | -- | |
| King Harry Lee | -- | -- | |
| Wells Jo Ann | -- | -- | |
| Anderson Stanley R | -- | -- | |
| -- | -- | -- |
Source: Public Records
Tax History Compared to Growth
Tax History
| Year | Tax Paid | Tax Assessment Tax Assessment Total Assessment is a certain percentage of the fair market value that is determined by local assessors to be the total taxable value of land and additions on the property. | Land | Improvement |
|---|---|---|---|---|
| 2025 | $203 | $7,975 | $1,400 | $6,575 |
| 2024 | $203 | $7,975 | $1,400 | $6,575 |
| 2023 | $349 | $7,975 | $1,400 | $6,575 |
| 2022 | $349 | $7,975 | $1,400 | $6,575 |
| 2021 | $349 | $7,975 | $1,400 | $6,575 |
| 2020 | $416 | $7,975 | $1,400 | $6,575 |
| 2019 | $416 | $8,300 | $1,750 | $6,550 |
| 2018 | $416 | $8,300 | $1,750 | $6,550 |
| 2017 | $418 | $8,300 | $1,750 | $6,550 |
| 2016 | $418 | $8,300 | $1,750 | $6,550 |
| 2015 | $402 | $8,300 | $1,750 | $6,550 |
| 2014 | -- | $8,425 | $1,750 | $6,675 |
Source: Public Records
Map
Nearby Homes
- 130 Baker Ave
- 36 Hamil St
- 71 4th St
- 180 & 184 Hillhouse St
- 0 S Church St
- 403 S College St
- 108 Williams Cir
- 00 Watson Cir
- 233 S Front St
- 0 Ringer Ln
- 213 W Main St
- 115 N College St
- 118 N College St
- 522 E Main St
- 731 W Tigrett St
- 10756 U S 51
- 510 E Tigrett St
- 326 Keltner St
- 335 Marshall Cove
- 557 Circle Dr