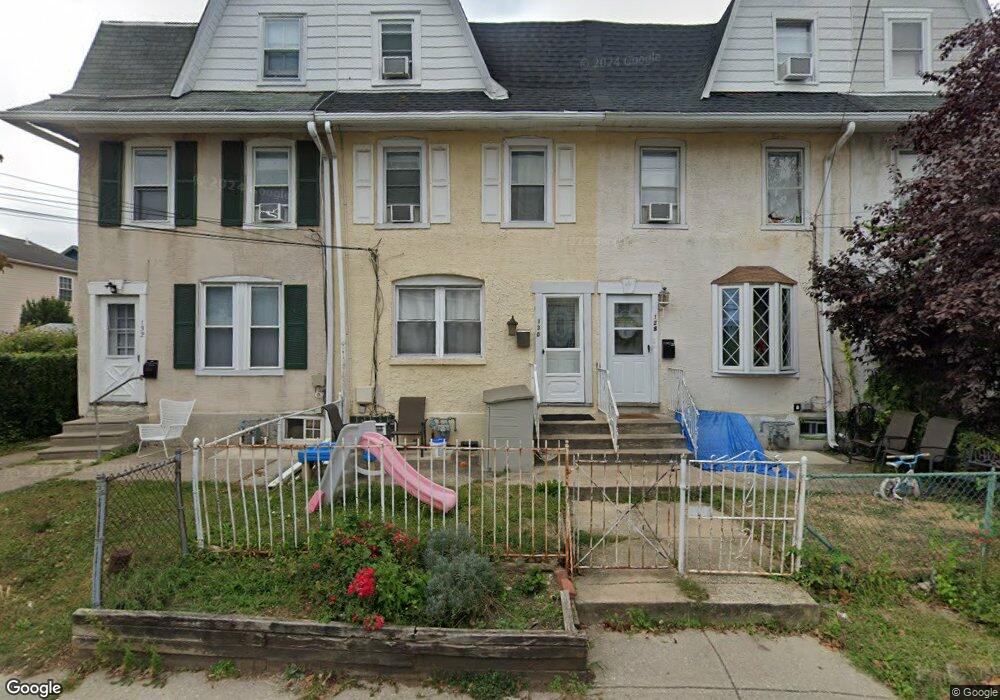
130 E Spring Ave Ardmore, PA 19003
Estimated Value: $349,000 - $493,000
4
Beds
1
Bath
1,568
Sq Ft
$255/Sq Ft
Est. Value
About This Home
This home is located at 130 E Spring Ave, Ardmore, PA 19003 and is currently estimated at $400,578, approximately $255 per square foot. 130 E Spring Ave is a home located in Montgomery County with nearby schools including Penn Valley School, Welsh Valley Middle School, and Lower Merion High School.
Ownership History
Date
Name
Owned For
Owner Type
Purchase Details
Closed on
Apr 25, 2011
Sold by
Sieller Nicole
Bought by
Bramson Jennifer L
Current Estimated Value
Home Financials for this Owner
Home Financials are based on the most recent Mortgage that was taken out on this home.
Original Mortgage
$181,771
Outstanding Balance
$125,815
Interest Rate
4.87%
Mortgage Type
FHA
Estimated Equity
$274,763
Purchase Details
Closed on
Dec 16, 2005
Sold by
Wilson Jeanette A and Wilson Marsha L
Bought by
Sieller Nicole
Home Financials for this Owner
Home Financials are based on the most recent Mortgage that was taken out on this home.
Original Mortgage
$29,400
Interest Rate
6.39%
Purchase Details
Closed on
Jun 14, 2005
Sold by
Hays Vivian Juanita and Brown Vernell
Bought by
Wilson Jeanette A and Wilson Marsha L
Home Financials for this Owner
Home Financials are based on the most recent Mortgage that was taken out on this home.
Original Mortgage
$94,500
Interest Rate
5.67%
Mortgage Type
Purchase Money Mortgage
Create a Home Valuation Report for This Property
The Home Valuation Report is an in-depth analysis detailing your home's value as well as a comparison with similar homes in the area
Home Values in the Area
Average Home Value in this Area
Purchase History
| Date | Buyer | Sale Price | Title Company |
|---|---|---|---|
| Bramson Jennifer L | $186,500 | None Available | |
| Sieller Nicole | $196,000 | Trident Land Transfer Co | |
| Wilson Jeanette A | $105,000 | -- |
Source: Public Records
Mortgage History
| Date | Status | Borrower | Loan Amount |
|---|---|---|---|
| Open | Bramson Jennifer L | $181,771 | |
| Previous Owner | Sieller Nicole | $29,400 | |
| Previous Owner | Wilson Jeanette A | $94,500 |
Source: Public Records
Tax History
| Year | Tax Paid | Tax Assessment Tax Assessment Total Assessment is a certain percentage of the fair market value that is determined by local assessors to be the total taxable value of land and additions on the property. | Land | Improvement |
|---|---|---|---|---|
| 2025 | $3,137 | $75,110 | $22,260 | $52,850 |
| 2024 | $3,137 | $75,110 | $22,260 | $52,850 |
| 2023 | $3,006 | $75,110 | $22,260 | $52,850 |
| 2022 | $2,950 | $75,110 | $22,260 | $52,850 |
| 2021 | $2,883 | $75,110 | $22,260 | $52,850 |
| 2020 | $2,813 | $75,110 | $22,260 | $52,850 |
| 2019 | $2,763 | $75,110 | $22,260 | $52,850 |
Source: Public Records
Map
Nearby Homes
- 145 Walnut Ave
- 140 Walnut Ave
- 222 Lippincott Ave
- 111 Saint Pauls Rd
- 825 Aubrey Ave
- 124 Grandview Rd
- 2757 Saint Marys Rd
- 754 Oak View Rd
- 724 Loraine St
- 2525 Olcott Ave
- 818 Clifford Ave
- 1504 Wynnewood Rd
- 801 Ardmore Ave
- 2432 Olcott Ave
- 201 Cobblestone Dr
- 86 Greenfield Ave
- 633 Georges Ln
- 700 Ardmore Ave Unit 424
- 601 Georges Ln
- 120 Sibley Ave Unit 203
- 128 E Spring Ave
- 126 E Spring Ave Unit 11
- 132 E Spring Ave
- 207 Sheas Terrace
- 122 E Spring Ave
- 209 Sheas Terrace
- 120 E Spring Ave Unit 22
- 206 Sheas Terrace
- 211 Sheas Terrace
- 208 Sheas Terrace
- 200 Linwood Ave
- 204 Linwood Ave
- 213 Sheas Terrace
- 210 Sheas Terrace Unit 78
- 137 E Spring Ave Unit 2F
- 137 E Spring Ave Unit 2R
- 133 E Spring Ave Unit 447
- 131 E Spring Ave
- 208 Linwood Ave
- 129 E Spring Ave
Your Personal Tour Guide
Ask me questions while you tour the home.