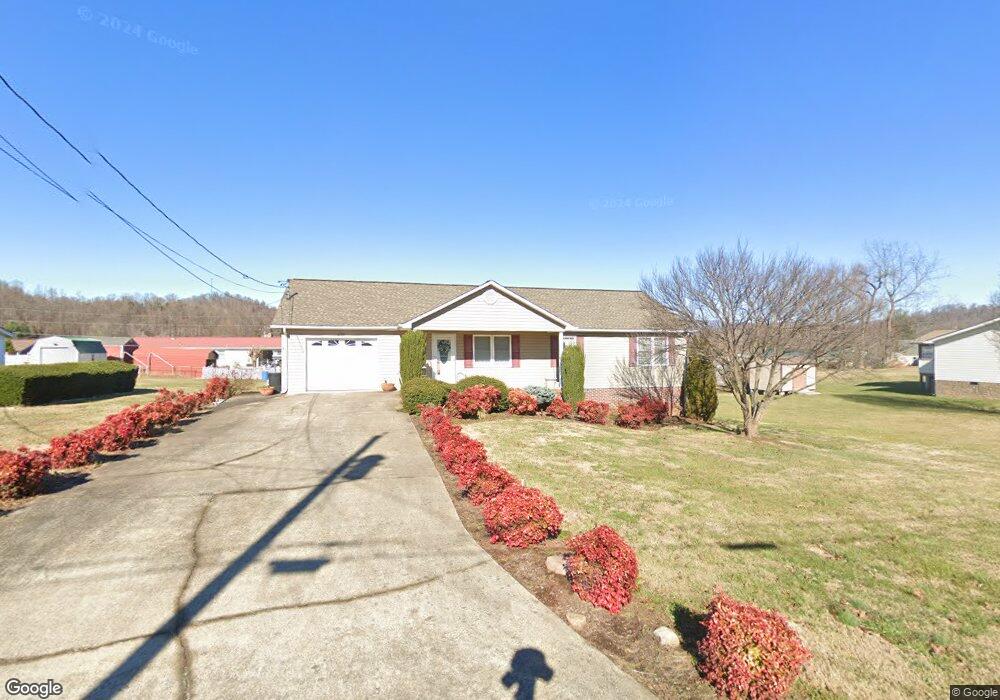
130 Earl Ave Elizabethton, TN 37643
Valley Forge NeighborhoodEstimated Value: $145,000 - $261,000
--
Bed
2
Baths
1,247
Sq Ft
$157/Sq Ft
Est. Value
About This Home
This home is located at 130 Earl Ave, Elizabethton, TN 37643 and is currently estimated at $195,768, approximately $156 per square foot. 130 Earl Ave is a home located in Carter County with nearby schools including East Tn Christian Home & Academy.
Ownership History
Date
Name
Owned For
Owner Type
Purchase Details
Closed on
Feb 6, 2023
Sold by
Potter Lisa Diane
Bought by
Guinn Johnathan Andrew
Current Estimated Value
Home Financials for this Owner
Home Financials are based on the most recent Mortgage that was taken out on this home.
Original Mortgage
$119,800
Outstanding Balance
$115,782
Interest Rate
6.15%
Estimated Equity
$79,986
Purchase Details
Closed on
Jan 21, 2023
Sold by
Guinn Johnny Wayne
Bought by
Guinn Johnathan Andrew
Home Financials for this Owner
Home Financials are based on the most recent Mortgage that was taken out on this home.
Original Mortgage
$119,800
Outstanding Balance
$115,782
Interest Rate
6.15%
Estimated Equity
$79,986
Purchase Details
Closed on
Sep 10, 2008
Sold by
Campbell Norma Jean
Bought by
Guinn Carol Ann
Purchase Details
Closed on
Jan 12, 2005
Sold by
Mays Donald R
Bought by
Campbell Norma Jean
Purchase Details
Closed on
Jan 11, 1963
Bought by
Estep Roy K and Mary Kate
Create a Home Valuation Report for This Property
The Home Valuation Report is an in-depth analysis detailing your home's value as well as a comparison with similar homes in the area
Home Values in the Area
Average Home Value in this Area
Purchase History
| Date | Buyer | Sale Price | Title Company |
|---|---|---|---|
| Guinn Johnathan Andrew | $189,000 | Patriot Title | |
| Guinn Johnathan Andrew | -- | Patriot Title | |
| Guinn Carol Ann | $38,078 | -- | |
| Campbell Norma Jean | $36,000 | -- | |
| Estep Roy K | -- | -- |
Source: Public Records
Mortgage History
| Date | Status | Borrower | Loan Amount |
|---|---|---|---|
| Open | Guinn Johnathan Andrew | $119,800 |
Source: Public Records
Tax History Compared to Growth
Tax History
| Year | Tax Paid | Tax Assessment Tax Assessment Total Assessment is a certain percentage of the fair market value that is determined by local assessors to be the total taxable value of land and additions on the property. | Land | Improvement |
|---|---|---|---|---|
| 2024 | $722 | $33,100 | $4,725 | $28,375 |
| 2023 | $722 | $33,100 | $0 | $0 |
| 2022 | $672 | $33,100 | $4,725 | $28,375 |
| 2021 | $672 | $33,100 | $4,725 | $28,375 |
| 2020 | $722 | $33,100 | $4,725 | $28,375 |
| 2019 | $722 | $29,250 | $4,050 | $25,200 |
| 2018 | $722 | $29,250 | $4,050 | $25,200 |
| 2017 | $722 | $29,250 | $4,050 | $25,200 |
| 2016 | $717 | $29,250 | $4,050 | $25,200 |
| 2015 | $717 | $29,250 | $4,050 | $25,200 |
| 2014 | $722 | $29,450 | $4,050 | $25,400 |
Source: Public Records
Map
Nearby Homes
- 136 Ruby Ave
- 142 Earl Ave
- 133 Bishop Cir
- 2600 State Line Rd
- 2108 State Line Rd
- 2100 State Line Rd
- 138 Lexington Ave
- 113 Constitution Ave
- 1439 Riverview Dr
- 105 Meredith Dr
- 117 Icy Ln
- Tbd Icy Ln
- 109 Yard Hill Rd
- 910 Fairview St
- 904 Walker St
- 225 Russell Hill Rd
- TBD River Rd
- 816 Riverview Dr
- 604 Trudy St
- Tbd Cannon Hill Dr