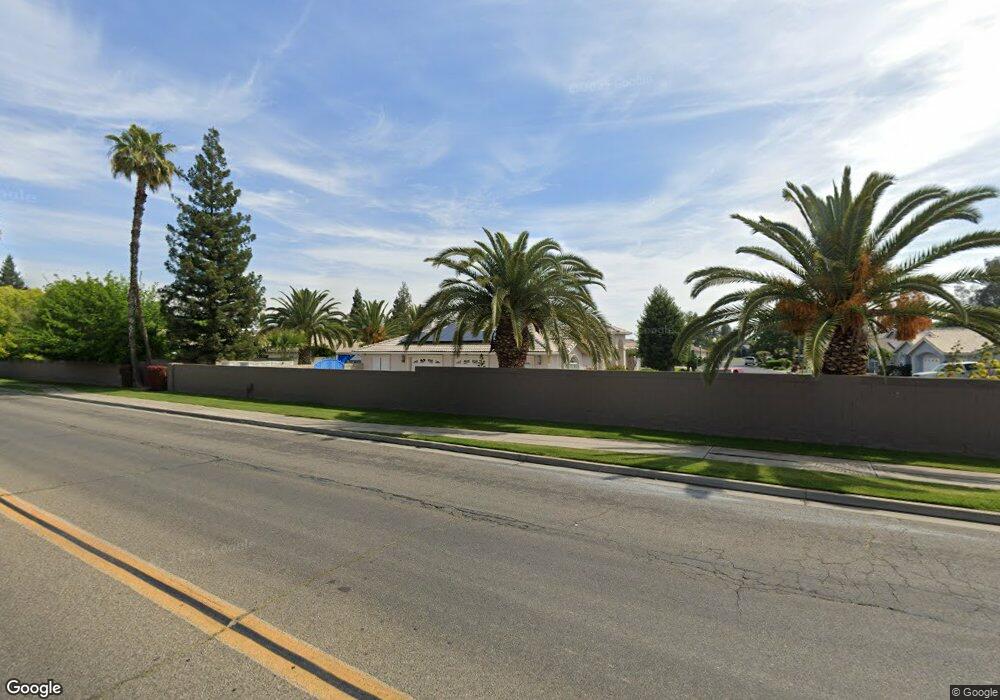
130 East Loop Madera, CA 93637
West Madera NeighborhoodEstimated Value: $493,000 - $775,000
4
Beds
3
Baths
3,360
Sq Ft
$192/Sq Ft
Est. Value
About This Home
This home is located at 130 East Loop, Madera, CA 93637 and is currently estimated at $644,650, approximately $191 per square foot. 130 East Loop is a home located in Madera County with nearby schools including Lincoln Elementary School, Thomas Jefferson Middle School, and Madera High School.
Ownership History
Date
Name
Owned For
Owner Type
Purchase Details
Closed on
Nov 7, 2016
Sold by
Wieland Charles and Wieland Catherine
Bought by
Wieland Charles A and Wieland Catherine L
Current Estimated Value
Home Financials for this Owner
Home Financials are based on the most recent Mortgage that was taken out on this home.
Original Mortgage
$312,800
Outstanding Balance
$249,772
Interest Rate
3.42%
Mortgage Type
New Conventional
Estimated Equity
$394,878
Purchase Details
Closed on
Oct 31, 2000
Sold by
Berry & Berry Inc
Bought by
Wieland Charles and Wieland Catherine
Create a Home Valuation Report for This Property
The Home Valuation Report is an in-depth analysis detailing your home's value as well as a comparison with similar homes in the area
Home Values in the Area
Average Home Value in this Area
Purchase History
| Date | Buyer | Sale Price | Title Company |
|---|---|---|---|
| Wieland Charles A | -- | Nations Title Company | |
| Wieland Charles | $55,000 | First American Title Co |
Source: Public Records
Mortgage History
| Date | Status | Borrower | Loan Amount |
|---|---|---|---|
| Open | Wieland Charles A | $312,800 |
Source: Public Records
Tax History
| Year | Tax Paid | Tax Assessment Tax Assessment Total Assessment is a certain percentage of the fair market value that is determined by local assessors to be the total taxable value of land and additions on the property. | Land | Improvement |
|---|---|---|---|---|
| 2025 | $5,628 | $489,704 | $82,863 | $406,841 |
| 2023 | $5,628 | $470,691 | $79,647 | $391,044 |
| 2022 | $5,258 | $461,463 | $78,086 | $383,377 |
| 2021 | $5,158 | $452,415 | $76,555 | $375,860 |
| 2020 | $5,252 | $447,778 | $75,771 | $372,007 |
| 2019 | $5,212 | $438,999 | $74,286 | $364,713 |
| 2018 | $4,807 | $430,392 | $72,830 | $357,562 |
| 2017 | $4,750 | $421,953 | $71,402 | $350,551 |
| 2016 | $4,630 | $413,680 | $70,002 | $343,678 |
| 2015 | $4,549 | $407,467 | $68,951 | $338,516 |
| 2014 | $4,247 | $399,486 | $67,601 | $331,885 |
Source: Public Records
Map
Nearby Homes
- 2808 Riverview Dr
- 2512 Driftwood Dr
- 901 Valley Way
- 185 River Pointe
- 2820 Driftwood Dr
- 3255 Hollow Ave
- 2724 Monocott Dr
- 3215 Tragon St
- 2050 Sundance Ln
- 0 Westberry Blvd Unit 20254508
- 0 Westberry Blvd Unit 224046052
- 2372 Ironwood Way
- 1417 San Pietro Dr
- 737 Harbor Dr
- 3147 Boulder Ave
- 29710 Avenue 15 1 2
- 1391 Shoreside Dr
- 1428 Shoreside Dr
- 15707 Road 22 1 2
- 3514 Nile St
- 0 S E St
- 0 S E St Unit 609569
- 0 S E St Unit 609574
- 0 S E St Unit 606932
- 0 S E St Unit 566121
- 0 S E St Unit 571430
- 0 S E St Unit 571433
- 0 S E St Unit 571437
- 0 S E St Unit 571438
- 0 S E St Unit 571436
- 0 S E St Unit 317309
- 0 S E St Unit 317307
- 0 S E St Unit 317306
- 0 S E St Unit 317305
- 0 S E St Unit 317304
- 0 S E St Unit 317303
- 0 S E St Unit 317302
- 0 S E St Unit 416604
- 0 S E St Unit 425779
- 0 S E St Unit 426535
