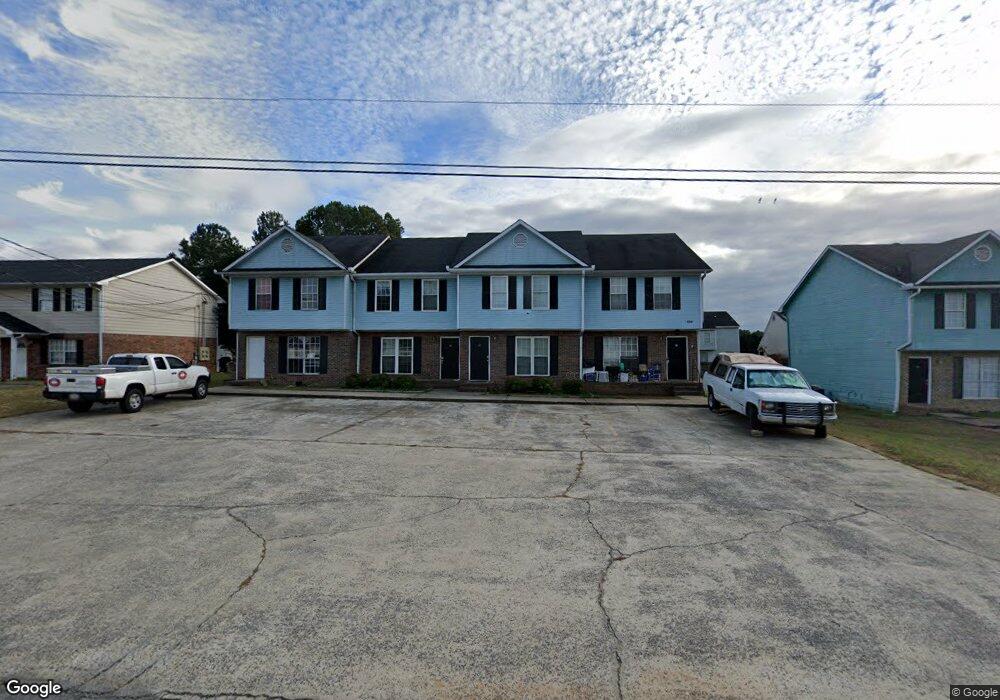
130 Evergreen Unit B Trail Cartersville, GA 30121
Estimated Value: $192,000 - $237,000
2
Beds
2
Baths
1,296
Sq Ft
$165/Sq Ft
Est. Value
About This Home
This home is located at 130 Evergreen Unit B Trail, Cartersville, GA 30121 and is currently estimated at $213,515, approximately $164 per square foot. 130 Evergreen Unit B Trail is a home located in Bartow County with nearby schools including White Elementary School, Cass Middle School, and Cass High School.
Ownership History
Date
Name
Owned For
Owner Type
Purchase Details
Closed on
May 18, 2020
Sold by
Floyd Mark Edwin
Bought by
Fisher Calvin E
Current Estimated Value
Home Financials for this Owner
Home Financials are based on the most recent Mortgage that was taken out on this home.
Original Mortgage
$62,016
Outstanding Balance
$43,379
Interest Rate
3.3%
Mortgage Type
New Conventional
Estimated Equity
$170,136
Purchase Details
Closed on
Oct 12, 2010
Sold by
Csmc Armt 2007 1
Bought by
Floyd Mark Edwin
Purchase Details
Closed on
Jul 6, 2010
Sold by
Brown Gregory L
Bought by
Us Bank National Association
Purchase Details
Closed on
Oct 5, 2005
Sold by
Federal National Mortgage Association
Bought by
Brown Gregory L and Brown Bridget N
Purchase Details
Closed on
Sep 6, 2005
Sold by
Citimortgage Inc
Bought by
Federal National Mtg Associati
Purchase Details
Closed on
Aug 2, 2005
Sold by
Edwards Jascinth C
Bought by
Citimortgage Inc
Create a Home Valuation Report for This Property
The Home Valuation Report is an in-depth analysis detailing your home's value as well as a comparison with similar homes in the area
Home Values in the Area
Average Home Value in this Area
Purchase History
| Date | Buyer | Sale Price | Title Company |
|---|---|---|---|
| Fisher Calvin E | $77,520 | -- | |
| Floyd Mark Edwin | $25,500 | -- | |
| Us Bank National Association | $22,525 | -- | |
| Brown Gregory L | $53,000 | -- | |
| Federal National Mtg Associati | -- | -- | |
| Citimortgage Inc | -- | -- | |
| Federal National Mtg Associati | -- | -- |
Source: Public Records
Mortgage History
| Date | Status | Borrower | Loan Amount |
|---|---|---|---|
| Open | Fisher Calvin E | $62,016 |
Source: Public Records
Tax History Compared to Growth
Tax History
| Year | Tax Paid | Tax Assessment Tax Assessment Total Assessment is a certain percentage of the fair market value that is determined by local assessors to be the total taxable value of land and additions on the property. | Land | Improvement |
|---|---|---|---|---|
| 2024 | $1,665 | $74,040 | $12,000 | $62,040 |
| 2023 | $1,799 | $74,692 | $10,000 | $64,692 |
| 2022 | $1,420 | $55,920 | $8,000 | $47,920 |
| 2021 | $827 | $42,069 | $8,000 | $34,069 |
| 2020 | $1,079 | $39,292 | $8,000 | $31,292 |
| 2019 | $983 | $35,425 | $8,000 | $27,425 |
| 2018 | $592 | $21,240 | $4,000 | $17,240 |
| 2017 | $595 | $21,240 | $4,000 | $17,240 |
| 2016 | $599 | $21,240 | $4,000 | $17,240 |
| 2015 | $600 | $21,240 | $4,000 | $17,240 |
| 2014 | -- | $15,200 | $2,000 | $13,200 |
| 2013 | -- | $13,320 | $2,000 | $11,320 |
Source: Public Records
Map
Nearby Homes
- 96 Benfield Cir
- 100 Benfield Cir
- 42 Berkeley Place
- 125 Evergreen Trail SE
- 17 Benfield Cir
- 25 Haley Place Unit 3
- 104 Gilreath Rd SE
- 32 Hampton Dr
- 15 Home Place Dr
- 27 Summer Place NW
- 59 Cottage Walk NW
- 111 Weston Way NW
- 10 Hawk Rd NW
- 217 Eva Way NE
- 74 Oakridge Dr SE
- 102 Potters Field NW
- 11 Meadow View Cir
- 130 Evergreen Unit D Trail
- 130 Evergreen Unit C Trail
- 130 Evergreen Trail Unit 2 & 3
- 130 Evergreen Trail Unit D
- 130 Evergreen Trail Unit C
- 130 Evergreen Trail Unit B
- 130 Evergreen Trail
- 132 Evergreen Trail
- 132 Evergreen Trail Unit D
- 132 Evergreen Trail Unit B
- 132 Evergreen Trail Unit C
- 132 Evergreen Trail Unit A
- 132 Evergreen Trail Unit 68
- 128 Evergreen Trail
- 128 Evergreen Trail Unit 3
- 128 Evergreen Trail Unit 4
- 128 Evergreen Trail Unit 2
- 87 Benfield Cir
- 89 Benfield Cir
- 85 Benfield Cir