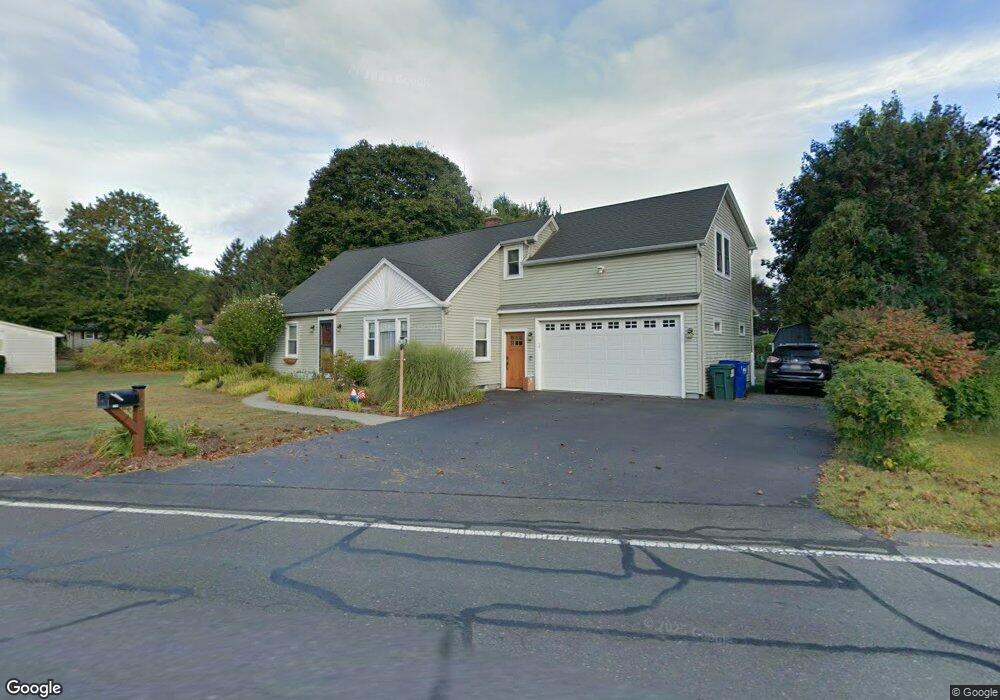
130 Hendrick St Easthampton, MA 01027
Estimated Value: $457,000 - $490,532
3
Beds
2
Baths
1,469
Sq Ft
$319/Sq Ft
Est. Value
About This Home
This home is located at 130 Hendrick St, Easthampton, MA 01027 and is currently estimated at $469,133, approximately $319 per square foot. 130 Hendrick St is a home located in Hampshire County with nearby schools including Easthampton High School, Tri-County Schools, and New England Adolescent Research Institute.
Ownership History
Date
Name
Owned For
Owner Type
Purchase Details
Closed on
Jun 24, 2003
Sold by
Dean Corey R and Dean Neha S S
Bought by
Neumann Jeffrey J and Neumann Sharon A
Current Estimated Value
Home Financials for this Owner
Home Financials are based on the most recent Mortgage that was taken out on this home.
Original Mortgage
$149,900
Interest Rate
5.71%
Mortgage Type
Purchase Money Mortgage
Purchase Details
Closed on
Oct 7, 1999
Sold by
Henchey Lucy C
Bought by
Dean Corey R and Dean Neha S
Home Financials for this Owner
Home Financials are based on the most recent Mortgage that was taken out on this home.
Original Mortgage
$103,200
Interest Rate
7.81%
Mortgage Type
Purchase Money Mortgage
Create a Home Valuation Report for This Property
The Home Valuation Report is an in-depth analysis detailing your home's value as well as a comparison with similar homes in the area
Home Values in the Area
Average Home Value in this Area
Purchase History
| Date | Buyer | Sale Price | Title Company |
|---|---|---|---|
| Neumann Jeffrey J | $189,901 | -- | |
| Dean Corey R | $129,000 | -- |
Source: Public Records
Mortgage History
| Date | Status | Borrower | Loan Amount |
|---|---|---|---|
| Open | Dean Corey R | $98,000 | |
| Closed | Dean Corey R | $149,900 | |
| Previous Owner | Dean Corey R | $100,000 | |
| Previous Owner | Dean Corey R | $103,200 |
Source: Public Records
Tax History
| Year | Tax Paid | Tax Assessment Tax Assessment Total Assessment is a certain percentage of the fair market value that is determined by local assessors to be the total taxable value of land and additions on the property. | Land | Improvement |
|---|---|---|---|---|
| 2025 | $6,154 | $450,200 | $110,900 | $339,300 |
| 2024 | $5,941 | $438,100 | $107,600 | $330,500 |
| 2023 | $4,399 | $300,300 | $85,500 | $214,800 |
| 2022 | $4,964 | $300,300 | $85,500 | $214,800 |
| 2021 | $5,497 | $313,400 | $85,500 | $227,900 |
| 2020 | $5,333 | $300,300 | $85,500 | $214,800 |
| 2019 | $4,440 | $287,200 | $85,500 | $201,700 |
| 2018 | $4,272 | $267,000 | $80,600 | $186,400 |
| 2017 | $3,894 | $240,200 | $77,400 | $162,800 |
| 2016 | $3,935 | $252,400 | $77,400 | $175,000 |
| 2015 | $3,824 | $252,400 | $77,400 | $175,000 |
Source: Public Records
Map
Nearby Homes
Your Personal Tour Guide
Ask me questions while you tour the home.