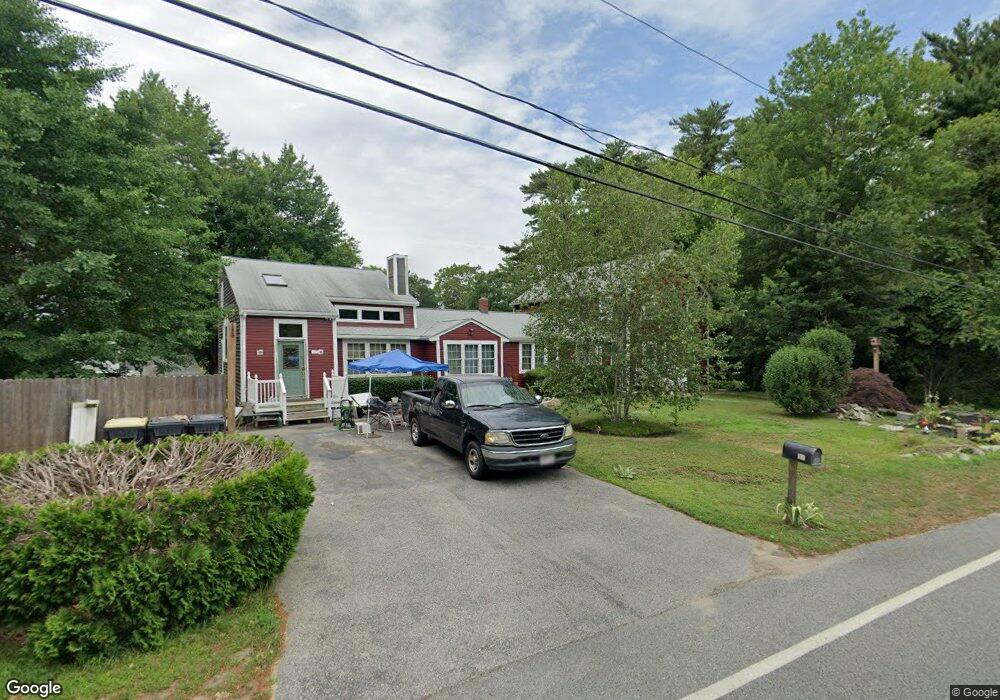
130 High St Carver, MA 02330
Estimated Value: $501,000 - $1,070,000
5
Beds
2
Baths
3,596
Sq Ft
$210/Sq Ft
Est. Value
About This Home
This home is located at 130 High St, Carver, MA 02330 and is currently estimated at $756,319, approximately $210 per square foot. 130 High St is a home located in Plymouth County with nearby schools including Carver Elementary School, Carver Middle/High School, and Sacred Heart High School.
Ownership History
Date
Name
Owned For
Owner Type
Purchase Details
Closed on
Sep 12, 2017
Sold by
Wynant Michael F and Wynant Cheryl E
Bought by
Wynant Cheryl E and Wynant Michael F
Current Estimated Value
Purchase Details
Closed on
Jun 30, 2008
Sold by
Wynant Michael F and Wynant Cheryl E
Bought by
Wynant Michael F and Wynant Cheryl E
Home Financials for this Owner
Home Financials are based on the most recent Mortgage that was taken out on this home.
Original Mortgage
$284,200
Interest Rate
6.07%
Mortgage Type
Purchase Money Mortgage
Create a Home Valuation Report for This Property
The Home Valuation Report is an in-depth analysis detailing your home's value as well as a comparison with similar homes in the area
Home Values in the Area
Average Home Value in this Area
Purchase History
| Date | Buyer | Sale Price | Title Company |
|---|---|---|---|
| Wynant Cheryl E | -- | -- | |
| Wynant Michael F | -- | -- |
Source: Public Records
Mortgage History
| Date | Status | Borrower | Loan Amount |
|---|---|---|---|
| Previous Owner | Wynant Michael F | $284,200 | |
| Previous Owner | Wynant Michael F | $225,000 |
Source: Public Records
Tax History Compared to Growth
Tax History
| Year | Tax Paid | Tax Assessment Tax Assessment Total Assessment is a certain percentage of the fair market value that is determined by local assessors to be the total taxable value of land and additions on the property. | Land | Improvement |
|---|---|---|---|---|
| 2025 | $10,096 | $727,900 | $144,300 | $583,600 |
| 2024 | $9,073 | $640,300 | $141,500 | $498,800 |
| 2023 | $8,645 | $592,500 | $141,500 | $451,000 |
| 2022 | $8,206 | $513,500 | $121,000 | $392,500 |
| 2021 | $7,511 | $443,400 | $108,000 | $335,400 |
| 2020 | $7,204 | $419,100 | $101,000 | $318,100 |
| 2019 | $6,944 | $407,300 | $98,000 | $309,300 |
| 2018 | $6,426 | $364,500 | $98,000 | $266,500 |
| 2017 | $6,131 | $346,600 | $94,300 | $252,300 |
| 2016 | $5,680 | $333,500 | $89,800 | $243,700 |
| 2015 | $5,280 | $310,400 | $89,800 | $220,600 |
| 2014 | $5,038 | $296,200 | $113,500 | $182,700 |
Source: Public Records
Map
Nearby Homes