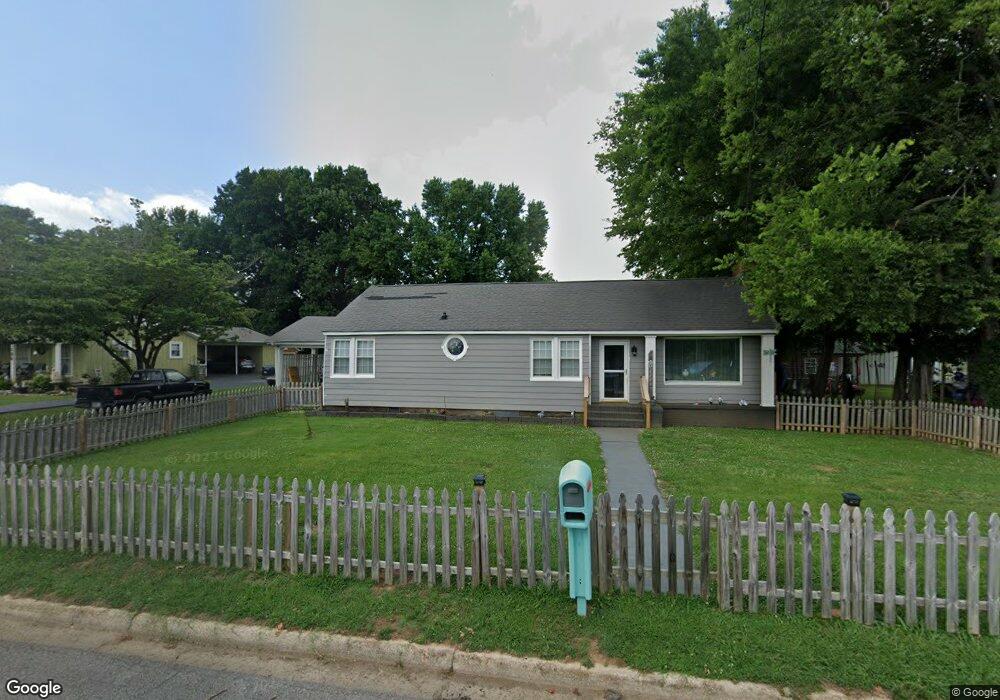
130 Jackson St Lawrenceburg, TN 38464
Estimated Value: $236,235 - $255,000
3
Beds
2
Baths
1,834
Sq Ft
$133/Sq Ft
Est. Value
About This Home
This home is located at 130 Jackson St, Lawrenceburg, TN 38464 and is currently estimated at $243,059, approximately $132 per square foot. 130 Jackson St is a home located in Lawrence County with nearby schools including Ingram Sowell Elementary School, Lawrenceburg Public Elementary School, and David Crockett Elementary School.
Ownership History
Date
Name
Owned For
Owner Type
Purchase Details
Closed on
Jun 26, 2020
Sold by
Gang Kristy and Citty Of Lawrenceburg
Bought by
Odeneal Tony and Odeneal Connie
Current Estimated Value
Purchase Details
Closed on
Aug 27, 2004
Sold by
Teddy Sisk
Bought by
Jason Sisk
Home Financials for this Owner
Home Financials are based on the most recent Mortgage that was taken out on this home.
Original Mortgage
$36,000
Interest Rate
6.01%
Purchase Details
Closed on
Nov 29, 1965
Bought by
Sisk Jimmy and Mary Jane
Purchase Details
Closed on
Jan 2, 1900
Create a Home Valuation Report for This Property
The Home Valuation Report is an in-depth analysis detailing your home's value as well as a comparison with similar homes in the area
Home Values in the Area
Average Home Value in this Area
Purchase History
| Date | Buyer | Sale Price | Title Company |
|---|---|---|---|
| Odeneal Tony | $37,000 | None Available | |
| Jason Sisk | $35,000 | -- | |
| Sisk Jimmy | -- | -- | |
| -- | -- | -- |
Source: Public Records
Mortgage History
| Date | Status | Borrower | Loan Amount |
|---|---|---|---|
| Previous Owner | Not Available | $36,000 |
Source: Public Records
Tax History Compared to Growth
Tax History
| Year | Tax Paid | Tax Assessment Tax Assessment Total Assessment is a certain percentage of the fair market value that is determined by local assessors to be the total taxable value of land and additions on the property. | Land | Improvement |
|---|---|---|---|---|
| 2025 | $1,277 | $41,100 | $0 | $0 |
| 2024 | $1,277 | $41,100 | $4,000 | $37,100 |
| 2023 | $1,277 | $41,100 | $4,000 | $37,100 |
| 2022 | $1,277 | $41,100 | $4,000 | $37,100 |
| 2021 | $961 | $21,875 | $2,500 | $19,375 |
| 2020 | $501 | $21,875 | $2,500 | $19,375 |
| 2019 | $501 | $11,400 | $2,500 | $8,900 |
| 2018 | $915 | $20,825 | $2,500 | $18,325 |
| 2017 | $915 | $20,825 | $2,500 | $18,325 |
| 2016 | $915 | $20,825 | $2,500 | $18,325 |
| 2015 | $867 | $20,825 | $2,500 | $18,325 |
| 2014 | $870 | $20,900 | $2,500 | $18,400 |
Source: Public Records
Map
Nearby Homes