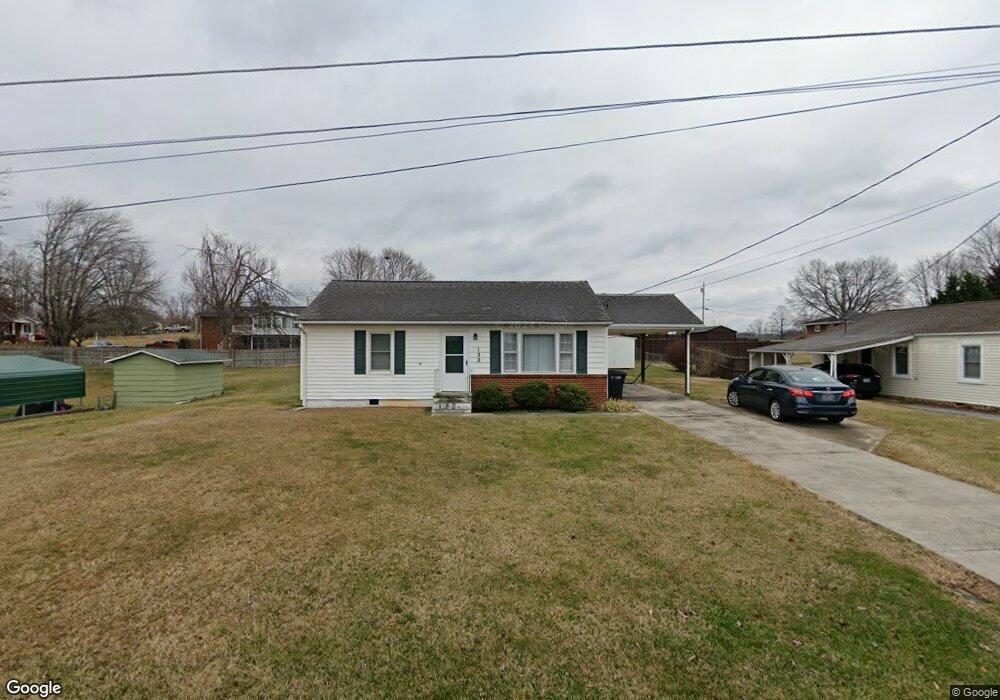
130 Jarrett Buck Loop Johnson City, TN 37601
Central NeighborhoodEstimated Value: $134,000 - $182,000
2
Beds
1
Bath
948
Sq Ft
$168/Sq Ft
Est. Value
About This Home
This home is located at 130 Jarrett Buck Loop, Johnson City, TN 37601 and is currently estimated at $159,168, approximately $167 per square foot. 130 Jarrett Buck Loop is a home located in Carter County with nearby schools including Solid Rock Academy, Munsey Kindergarten, and Central Baptist Preschool & Kindergarten.
Ownership History
Date
Name
Owned For
Owner Type
Purchase Details
Closed on
Oct 16, 2006
Sold by
Humphrey Martha R
Bought by
Hoilman Bryan G
Current Estimated Value
Home Financials for this Owner
Home Financials are based on the most recent Mortgage that was taken out on this home.
Original Mortgage
$45,000
Interest Rate
6.39%
Purchase Details
Closed on
Oct 25, 2002
Sold by
Ayers Kenneth C
Bought by
Humphrey Martha R
Home Financials for this Owner
Home Financials are based on the most recent Mortgage that was taken out on this home.
Original Mortgage
$55,000
Interest Rate
5.93%
Purchase Details
Closed on
Nov 13, 1997
Sold by
Hensley Barry S
Bought by
Miller Kristie
Home Financials for this Owner
Home Financials are based on the most recent Mortgage that was taken out on this home.
Original Mortgage
$48,350
Interest Rate
7.35%
Purchase Details
Closed on
Mar 31, 1993
Bought by
Hensley Barry S and Hensley Kristie A
Purchase Details
Closed on
Oct 28, 1974
Bought by
Foster Gary
Create a Home Valuation Report for This Property
The Home Valuation Report is an in-depth analysis detailing your home's value as well as a comparison with similar homes in the area
Home Values in the Area
Average Home Value in this Area
Purchase History
| Date | Buyer | Sale Price | Title Company |
|---|---|---|---|
| Hoilman Bryan G | $53,500 | -- | |
| Humphrey Martha R | $55,000 | -- | |
| Miller Kristie | $49,000 | -- | |
| Hensley Barry S | $35,000 | -- | |
| Foster Gary | -- | -- |
Source: Public Records
Mortgage History
| Date | Status | Borrower | Loan Amount |
|---|---|---|---|
| Closed | Foster Gary | $45,000 | |
| Previous Owner | Foster Gary | $55,000 | |
| Previous Owner | Foster Gary | $48,350 |
Source: Public Records
Tax History Compared to Growth
Tax History
| Year | Tax Paid | Tax Assessment Tax Assessment Total Assessment is a certain percentage of the fair market value that is determined by local assessors to be the total taxable value of land and additions on the property. | Land | Improvement |
|---|---|---|---|---|
| 2024 | $453 | $20,800 | $3,950 | $16,850 |
| 2023 | $453 | $20,800 | $0 | $0 |
| 2022 | $422 | $20,800 | $3,950 | $16,850 |
| 2021 | $422 | $20,800 | $3,950 | $16,850 |
| 2020 | $411 | $20,800 | $3,950 | $16,850 |
| 2019 | $411 | $16,625 | $3,250 | $13,375 |
| 2018 | $411 | $16,625 | $3,250 | $13,375 |
| 2017 | $410 | $16,600 | $3,250 | $13,350 |
| 2016 | $407 | $16,600 | $3,250 | $13,350 |
| 2015 | $407 | $16,600 | $3,250 | $13,350 |
| 2014 | $417 | $17,000 | $3,250 | $13,750 |
Source: Public Records
Map
Nearby Homes
- 244 Sinking Creek Rd
- 2504 Elizabethton Hwy
- 131 Greenlee Rd
- 2142 Dave Buck Rd
- Hillside Hillside Dr
- 119 Hillside Dr
- 115 Hillside Dr
- 119 Carrville Ave
- 121 Clark Dr
- 194 Sparks Rd
- 1960 Dave Buck Rd
- 110 Warrior Ln Unit 2
- 101 Glaze Farm Way
- 40 Glaze Farm Way
- 94 Glaze Farm Way
- 45 Glaze Farm Way
- 35 Glaze Farm Way
- 31 Glaze Farm Way
- 60 Glaze Farm Way
- 70 Glaze Farm Way
- 102 Whitney Ln
- 128 Jarrett Buck Loop
- 135 Bowers St
- 139 Bowers St
- 149 Jarrett Buck Loop
- 124 Jarrett Buck Loop
- 148 Jarrett Buck Loop
- 106 Whitney Ln
- 127 Bowers St
- 127 Jarrett St
- 120 Jarrett Buck Loop
- 238 Hopson Rd
- 121 Bowers St
- 140 Bowers St
- 159 Jarrett Buck Loop
- 163 Jarrett Buck Loop
- 118 Jarrett Buck Loop
- 119 Jarrett Buck Loop
- 156 Jarrett Buck Loop
- 114 Jarrett Buck Loop