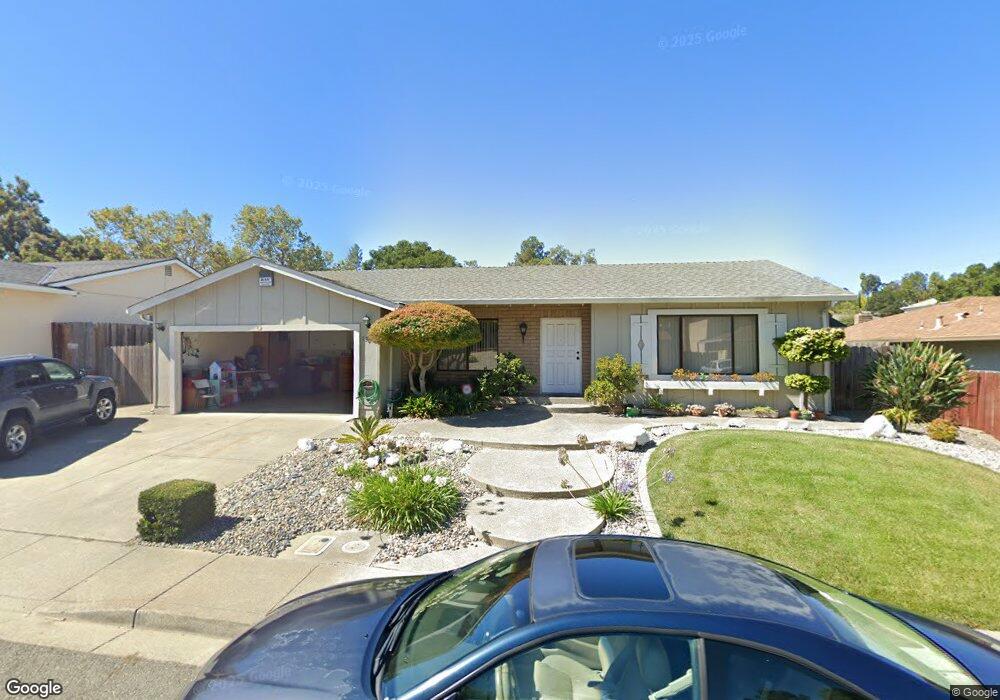
130 Lytham Way Vallejo, CA 94591
Estimated Value: $624,483 - $664,000
4
Beds
3
Baths
2,085
Sq Ft
$309/Sq Ft
Est. Value
About This Home
This home is located at 130 Lytham Way, Vallejo, CA 94591 and is currently estimated at $644,621, approximately $309 per square foot. 130 Lytham Way is a home located in Solano County with nearby schools including Joseph H. Wardlaw Elementary School, Hogan Middle School, and Jesse M. Bethel High School.
Ownership History
Date
Name
Owned For
Owner Type
Purchase Details
Closed on
Dec 19, 2008
Sold by
Wachovia Mortgage Fsb
Bought by
Mejia Nicole M
Current Estimated Value
Home Financials for this Owner
Home Financials are based on the most recent Mortgage that was taken out on this home.
Original Mortgage
$260,440
Outstanding Balance
$172,337
Interest Rate
6.16%
Mortgage Type
Purchase Money Mortgage
Estimated Equity
$472,284
Purchase Details
Closed on
Aug 25, 2008
Sold by
Campbell John D and Campbell Monika D
Bought by
Wachovia Mortgage Fsb
Purchase Details
Closed on
Feb 25, 1997
Sold by
Knotts Lawrence P and Knotts A E
Bought by
Campbell John D and Campbell Monika D
Home Financials for this Owner
Home Financials are based on the most recent Mortgage that was taken out on this home.
Original Mortgage
$165,000
Interest Rate
6%
Purchase Details
Closed on
Sep 30, 1994
Sold by
Rose Carl A and Rose Rossella G
Bought by
Knotts Lawrence P and Knotts Amanda E
Create a Home Valuation Report for This Property
The Home Valuation Report is an in-depth analysis detailing your home's value as well as a comparison with similar homes in the area
Purchase History
| Date | Buyer | Sale Price | Title Company |
|---|---|---|---|
| Mejia Nicole M | $306,500 | Fidelity National Title Co | |
| Wachovia Mortgage Fsb | $261,580 | None Available | |
| Campbell John D | $185,000 | North American Title Co | |
| Knotts Lawrence P | $185,000 | Frontier Title Company |
Source: Public Records
Mortgage History
| Date | Status | Borrower | Loan Amount |
|---|---|---|---|
| Open | Mejia Nicole M | $260,440 | |
| Previous Owner | Campbell John D | $165,000 |
Source: Public Records
Tax History
| Year | Tax Paid | Tax Assessment Tax Assessment Total Assessment is a certain percentage of the fair market value that is determined by local assessors to be the total taxable value of land and additions on the property. | Land | Improvement |
|---|---|---|---|---|
| 2025 | $6,077 | $402,453 | $85,374 | $317,079 |
| 2024 | $6,077 | $394,562 | $83,700 | $310,862 |
| 2023 | $5,766 | $386,826 | $82,059 | $304,767 |
| 2022 | $5,668 | $379,242 | $80,450 | $298,792 |
| 2021 | $5,544 | $371,807 | $78,873 | $292,934 |
| 2020 | $5,571 | $367,996 | $78,065 | $289,931 |
| 2019 | $5,417 | $360,782 | $76,535 | $284,247 |
| 2018 | $5,099 | $353,709 | $75,035 | $278,674 |
| 2017 | $4,791 | $346,774 | $73,564 | $273,210 |
| 2016 | $4,117 | $339,975 | $72,122 | $267,853 |
| 2015 | $4,039 | $334,869 | $71,039 | $263,830 |
| 2014 | $3,979 | $328,310 | $69,648 | $258,662 |
Source: Public Records
Map
Nearby Homes
- 118 Lytham Way
- 124 Pierre Ct
- N/A N A
- 1290 Rachel Way
- 453 Knights Cir
- 124 Gregory Ln
- 155 White Pine Dr
- 841 Knights Cir
- 401 Avian Dr
- 22 Brighton Dr
- 367 Darley Dr
- 102 Avian Dr
- 136 Evergreen Way
- 1202 Rollingwood Dr Unit 11A
- 6067 Loire Ct
- 103 Sandalwood Ct
- 100 Justin Ct
- 3011 Tennessee St
- 6206 Pebble Beach Dr
- 2500 Springs Rd Unit 121
Your Personal Tour Guide
Ask me questions while you tour the home.