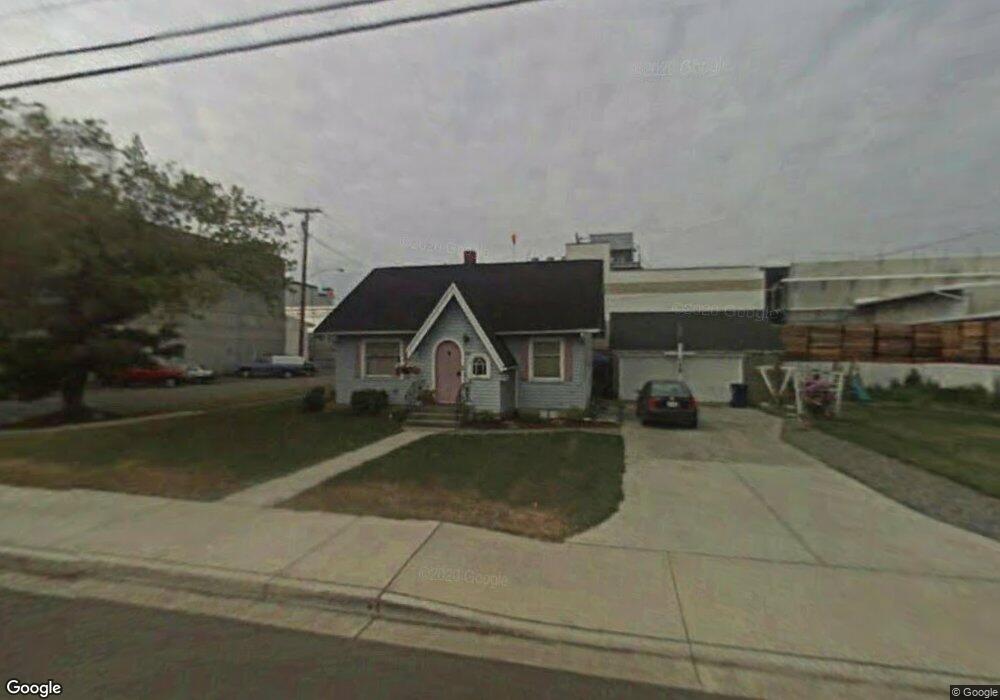
130 Main St Lynden, WA 98264
Estimated Value: $432,000 - $473,000
3
Beds
2
Baths
997
Sq Ft
$448/Sq Ft
Est. Value
About This Home
This home is located at 130 Main St, Lynden, WA 98264 and is currently estimated at $446,833, approximately $448 per square foot. 130 Main St is a home located in Whatcom County with nearby schools including Lynden High School, Lynden Christian School, and Lynden Christian Schools: Administration.
Ownership History
Date
Name
Owned For
Owner Type
Purchase Details
Closed on
Jun 22, 2000
Sold by
Stuurmans Seymour C and Stuurmans Luella M
Bought by
King Nathan and King Teressa
Current Estimated Value
Home Financials for this Owner
Home Financials are based on the most recent Mortgage that was taken out on this home.
Original Mortgage
$81,000
Outstanding Balance
$28,861
Interest Rate
8.37%
Estimated Equity
$417,972
Create a Home Valuation Report for This Property
The Home Valuation Report is an in-depth analysis detailing your home's value as well as a comparison with similar homes in the area
Home Values in the Area
Average Home Value in this Area
Purchase History
| Date | Buyer | Sale Price | Title Company |
|---|---|---|---|
| King Nathan | $108,000 | First American Title Ins |
Source: Public Records
Mortgage History
| Date | Status | Borrower | Loan Amount |
|---|---|---|---|
| Open | King Nathan | $81,000 | |
| Closed | King Nathan | $15,900 |
Source: Public Records
Tax History Compared to Growth
Tax History
| Year | Tax Paid | Tax Assessment Tax Assessment Total Assessment is a certain percentage of the fair market value that is determined by local assessors to be the total taxable value of land and additions on the property. | Land | Improvement |
|---|---|---|---|---|
| 2024 | $2,722 | $380,406 | $186,604 | $193,802 |
| 2023 | $2,722 | $378,723 | $192,375 | $186,348 |
| 2022 | $2,369 | $311,158 | $117,332 | $193,826 |
| 2021 | $2,324 | $257,152 | $96,967 | $160,185 |
| 2020 | $2,035 | $229,606 | $86,580 | $143,026 |
| 2019 | $1,811 | $210,602 | $79,495 | $131,107 |
| 2018 | $1,979 | $192,046 | $72,417 | $119,629 |
| 2017 | $1,900 | $172,377 | $65,000 | $107,377 |
| 2016 | $1,798 | $176,097 | $66,000 | $110,097 |
| 2015 | $1,594 | $165,724 | $63,480 | $102,244 |
| 2014 | -- | $160,106 | $61,320 | $98,786 |
| 2013 | -- | $158,786 | $60,000 | $98,786 |
Source: Public Records
Map
Nearby Homes
- 209 Liberty St
- 126 E Grover St Unit 6
- 211 Maple St
- 102 Riverwalk Dr
- 104 Riverwalk Dr
- 208 Riverwalk Dr
- 116 Riverwalk Dr
- 518 Edson St
- 202 Skipping Stone Loop
- 208 Skipping Stone Loop
- 204 Skipping Stone Loop
- 301 S Park St
- 214 Skipping Stone Loop
- 205 Riverwalk Dr
- 215 Skipping Stone Loop
- 204 Pebblebrook Dr
- 220 Skipping Stone Loop
- 205 Pebblebrook Dr
- 207 Pebblebrook Dr
- 206 Pebblebrook Dr