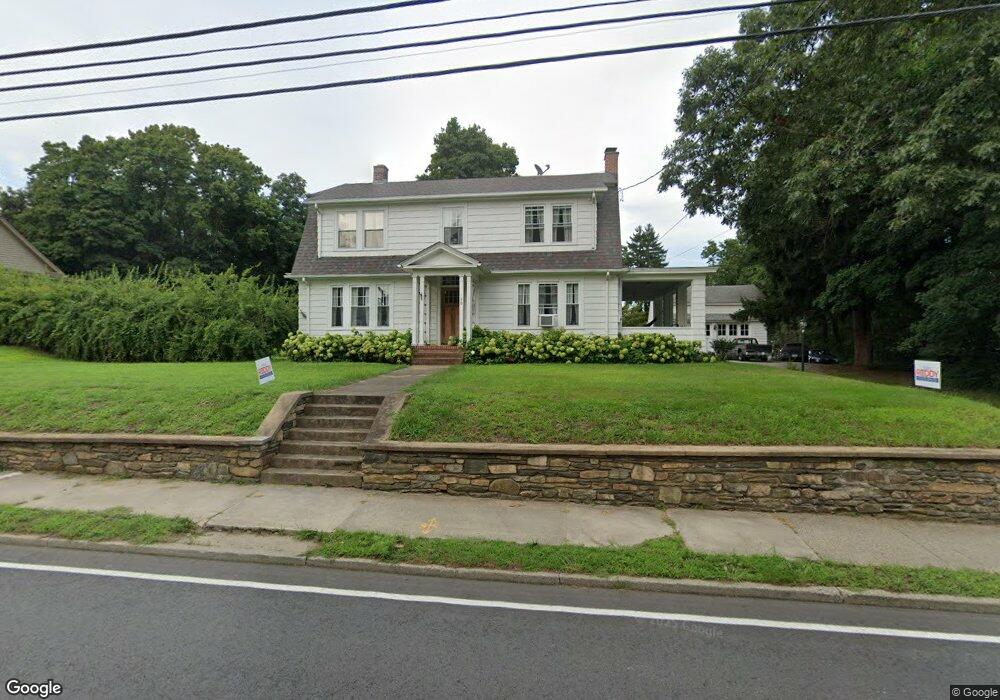
130 Maple St Danielson, CT 06239
Estimated Value: $358,195 - $400,000
4
Beds
2
Baths
2,271
Sq Ft
$171/Sq Ft
Est. Value
About This Home
This home is located at 130 Maple St, Danielson, CT 06239 and is currently estimated at $387,799, approximately $170 per square foot. 130 Maple St is a home located in Windham County with nearby schools including Killingly Central School, Killingly Memorial School, and Killingly Intermediate School.
Ownership History
Date
Name
Owned For
Owner Type
Purchase Details
Closed on
Dec 20, 2006
Sold by
Derosa Michael A and Fonseca Crystal R
Bought by
Antonelli Nathan and Antonelli Liegh
Current Estimated Value
Home Financials for this Owner
Home Financials are based on the most recent Mortgage that was taken out on this home.
Original Mortgage
$208,500
Interest Rate
6.35%
Purchase Details
Closed on
Apr 29, 2003
Sold by
Lavigne Ronald H and Lavigne Carol A
Bought by
Derosa Michael A and Fonseca Crystal R
Purchase Details
Closed on
Oct 15, 1998
Sold by
Cassettari Joanne A
Bought by
Lavigne Ronald H and Lavigne Carol A
Create a Home Valuation Report for This Property
The Home Valuation Report is an in-depth analysis detailing your home's value as well as a comparison with similar homes in the area
Home Values in the Area
Average Home Value in this Area
Purchase History
| Date | Buyer | Sale Price | Title Company |
|---|---|---|---|
| Antonelli Nathan | $278,000 | -- | |
| Antonelli Nathan | $278,000 | -- | |
| Derosa Michael A | $189,900 | -- | |
| Derosa Michael A | $189,900 | -- | |
| Lavigne Ronald H | $140,000 | -- | |
| Lavigne Ronald H | $140,000 | -- |
Source: Public Records
Mortgage History
| Date | Status | Borrower | Loan Amount |
|---|---|---|---|
| Open | Lavigne Ronald H | $211,600 | |
| Closed | Lavigne Ronald H | $208,500 | |
| Closed | Lavigne Ronald H | $69,500 |
Source: Public Records
Tax History
| Year | Tax Paid | Tax Assessment Tax Assessment Total Assessment is a certain percentage of the fair market value that is determined by local assessors to be the total taxable value of land and additions on the property. | Land | Improvement |
|---|---|---|---|---|
| 2025 | $5,197 | $207,470 | $31,290 | $176,180 |
| 2024 | $4,961 | $207,470 | $31,290 | $176,180 |
| 2023 | $5,492 | $171,150 | $25,970 | $145,180 |
| 2022 | $5,167 | $171,150 | $25,970 | $145,180 |
| 2021 | $5,167 | $171,150 | $25,970 | $145,180 |
| 2020 | $5,081 | $171,150 | $25,970 | $145,180 |
| 2019 | $5,136 | $171,150 | $25,970 | $145,180 |
| 2017 | $4,243 | $131,530 | $16,870 | $114,660 |
| 2016 | $4,243 | $131,530 | $16,870 | $114,660 |
| 2015 | $4,158 | $131,530 | $16,870 | $114,660 |
| 2014 | $4,059 | $131,530 | $16,870 | $114,660 |
Source: Public Records
Map
Nearby Homes
- 138 Maple St
- 118 Maple St
- 18 Palmer St
- 22 Palmer St
- 123 Maple St
- 55 Prospect Ave
- 4 W Palmer St
- 148 Maple St
- 59 Prospect Ave
- 63 Prospect Ave
- 51 Prospect Ave
- 28 Palmer St
- 67 Prospect Ave
- 47 Prospect Ave
- 11 Frederick St
- 43 Prospect Ave
- 19 Palmer St
- 10 W Palmer St
- 105 Maple St Unit 3rd Floor
- 105 Maple St
Your Personal Tour Guide
Ask me questions while you tour the home.