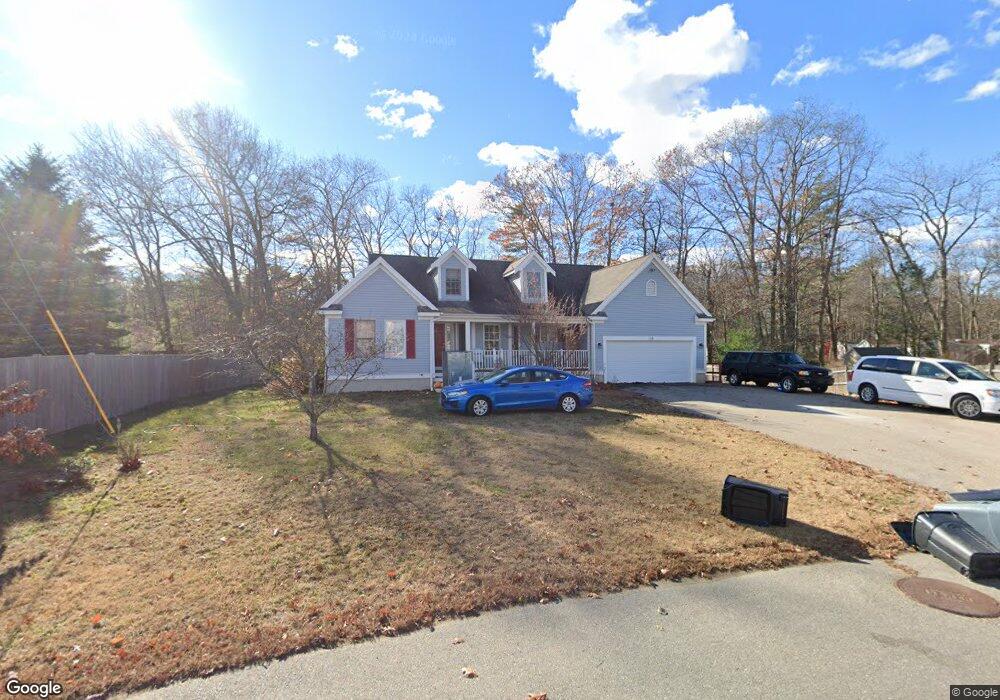
130 Marshview Cir Seabrook, NH 03874
Estimated Value: $724,000 - $842,000
6
Beds
3
Baths
2,483
Sq Ft
$309/Sq Ft
Est. Value
About This Home
This home is located at 130 Marshview Cir, Seabrook, NH 03874 and is currently estimated at $766,604, approximately $308 per square foot. 130 Marshview Cir is a home located in Rockingham County with nearby schools including Seabrook Elementary School, Seabrook Middle School, and Winnacunnet High School.
Ownership History
Date
Name
Owned For
Owner Type
Purchase Details
Closed on
Jan 25, 2021
Sold by
Gloria D Peel Ret
Bought by
Gloria D Peel Ret
Current Estimated Value
Home Financials for this Owner
Home Financials are based on the most recent Mortgage that was taken out on this home.
Original Mortgage
$622,500
Outstanding Balance
$609,562
Interest Rate
2.56%
Mortgage Type
Adjustable Rate Mortgage/ARM
Estimated Equity
$157,042
Purchase Details
Closed on
Oct 2, 2020
Sold by
Peel Gloria D
Bought by
Gloria D Peel Ret
Purchase Details
Closed on
Dec 6, 2018
Sold by
Peel Louis J
Bought by
Peel Gloria D
Purchase Details
Closed on
Jun 29, 1999
Sold by
Seabrook Shores Ests I
Bought by
Peel Louis J and Peel Gloria D
Home Financials for this Owner
Home Financials are based on the most recent Mortgage that was taken out on this home.
Original Mortgage
$193,215
Interest Rate
7.09%
Mortgage Type
Purchase Money Mortgage
Create a Home Valuation Report for This Property
The Home Valuation Report is an in-depth analysis detailing your home's value as well as a comparison with similar homes in the area
Home Values in the Area
Average Home Value in this Area
Purchase History
| Date | Buyer | Sale Price | Title Company |
|---|---|---|---|
| Gloria D Peel Ret | -- | None Available | |
| Gloria D Peel Ret | -- | None Available | |
| Peel Gloria D | -- | -- | |
| Peel Louis J | $60,000 | -- |
Source: Public Records
Mortgage History
| Date | Status | Borrower | Loan Amount |
|---|---|---|---|
| Open | Gloria D Peel Ret | $622,500 | |
| Previous Owner | Peel Louis J | $230,000 | |
| Previous Owner | Peel Louis J | $193,215 |
Source: Public Records
Tax History Compared to Growth
Tax History
| Year | Tax Paid | Tax Assessment Tax Assessment Total Assessment is a certain percentage of the fair market value that is determined by local assessors to be the total taxable value of land and additions on the property. | Land | Improvement |
|---|---|---|---|---|
| 2024 | $7,993 | $682,000 | $293,200 | $388,800 |
| 2023 | $8,318 | $551,200 | $233,200 | $318,000 |
| 2022 | $7,303 | $551,200 | $233,200 | $318,000 |
| 2021 | $7,568 | $551,200 | $233,200 | $318,000 |
| 2020 | $6,923 | $433,500 | $176,900 | $256,600 |
| 2019 | $6,828 | $433,500 | $176,900 | $256,600 |
| 2018 | $7,044 | $433,500 | $176,900 | $256,600 |
| 2017 | $6,971 | $429,000 | $176,900 | $252,100 |
| 2016 | $6,490 | $438,800 | $186,700 | $252,100 |
| 2015 | $5,432 | $367,300 | $138,400 | $228,900 |
| 2014 | $5,609 | $367,300 | $138,400 | $228,900 |
| 2013 | $5,624 | $368,300 | $138,400 | $229,900 |
Source: Public Records
Map
Nearby Homes
- 1 Old Salt Dr
- 35 Norman Rd
- 176 Lower Collins St
- 57 Washington St
- 312 S Main St
- 308 Route 286 Unit 77
- 308 Route 286 Unit Lot 58
- 64 Seabrook Rd
- 14 Coleman Ct
- 28 Brooks Rd
- 10 Caitlin Cir Unit B
- 44 Seabrook Rd
- 2 Collins St
- 100 Forest Rd
- 308 State Route 286 Unit Lot 73
- 308 State Route 286 Unit Lot 108
- 308 State Route 286 Unit Lot 87
- 241 & 245 Lafayette Rd
- 8 Kimberly Dr
- 22 Farm Ln
- 134 Marshview Cir
- 126 Marshview Cir
- 1 Marshview Cir
- 138 Marshview Cir
- 122 Marshview Cir
- 5 Marshview Cir
- 59 Adams Ave
- 2 Old Salt Dr
- 118 Marshview Cir
- 2 Marshview Cir
- 9 Marshview Cir
- 53 Adams Ave
- 6 Old Salt Dr
- 5 Elephant Rock Rd
- 7 Elephant Rock Rd
- 114 Marshview Cir
- 3 Elephant Rock Rd
- 3 Elephant Rock Rd Unit B
- 3 Elephant Rock Rd Unit 3
- 10 Old Salt Dr