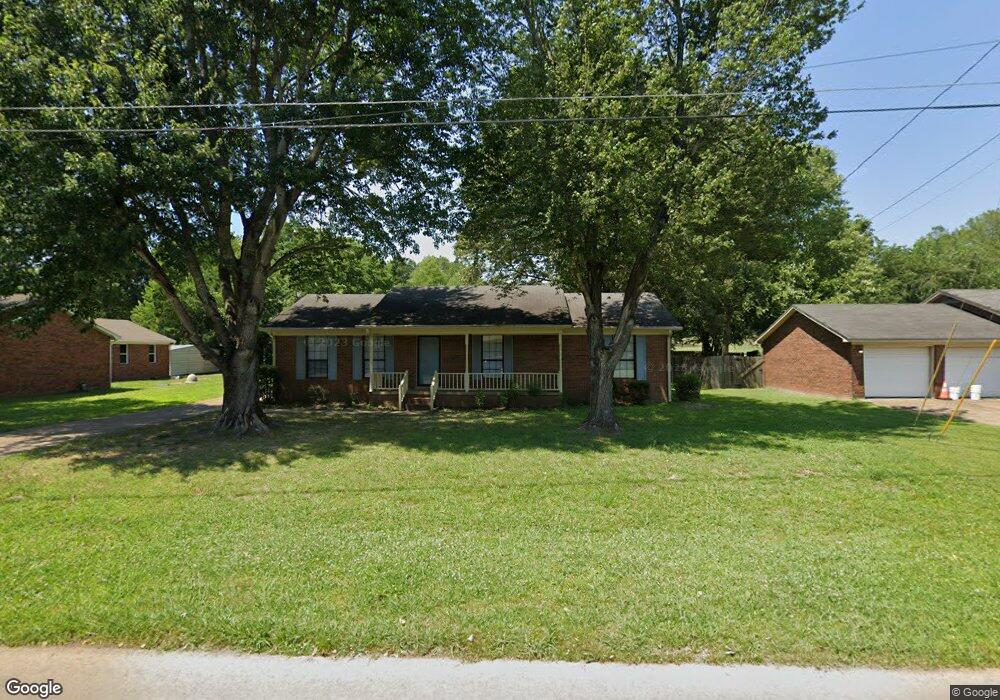
130 McGee Loop Jackson, TN 38305
Estimated Value: $166,000 - $191,000
3
Beds
2
Baths
1,431
Sq Ft
$124/Sq Ft
Est. Value
About This Home
This home is located at 130 McGee Loop, Jackson, TN 38305 and is currently estimated at $177,885, approximately $124 per square foot. 130 McGee Loop is a home located in Madison County with nearby schools including East Elementary School, Northeast Middle School, and North Side High School.
Ownership History
Date
Name
Owned For
Owner Type
Purchase Details
Closed on
Aug 11, 2022
Sold by
Wheeler Jesse
Bought by
June Jess and June Lonna Kirk
Current Estimated Value
Purchase Details
Closed on
Apr 6, 2012
Sold by
Us Bank National Associati
Bought by
Wheeler Jesse and June Jess
Purchase Details
Closed on
Feb 10, 2012
Sold by
Chrystak Tamika
Bought by
Us Bank National Association T
Purchase Details
Closed on
Aug 22, 2005
Sold by
Hillis John D
Bought by
Etvir Chrystak Tamika
Home Financials for this Owner
Home Financials are based on the most recent Mortgage that was taken out on this home.
Original Mortgage
$72,000
Interest Rate
5.64%
Purchase Details
Closed on
Oct 25, 2002
Sold by
Hillis John D
Bought by
Hillis Shelia B
Purchase Details
Closed on
Dec 29, 1995
Bought by
Hillis John D
Purchase Details
Closed on
Aug 18, 1989
Bought by
Monroe Kevin B
Purchase Details
Closed on
May 30, 1986
Bought by
Reeves Wade P
Purchase Details
Closed on
Jan 10, 1986
Purchase Details
Closed on
Apr 8, 1955
Create a Home Valuation Report for This Property
The Home Valuation Report is an in-depth analysis detailing your home's value as well as a comparison with similar homes in the area
Purchase History
| Date | Buyer | Sale Price | Title Company |
|---|---|---|---|
| June Jess | -- | None Listed On Document | |
| Wheeler Jesse | $63,300 | -- | |
| Us Bank National Association T | $57,600 | -- | |
| Etvir Chrystak Tamika | $90,000 | -- | |
| Hillis Shelia B | -- | -- | |
| Hillis John D | $65,000 | -- | |
| Monroe Kevin B | $49,700 | -- | |
| Reeves Wade P | -- | -- | |
| -- | -- | -- | |
| -- | -- | -- |
Source: Public Records
Mortgage History
| Date | Status | Borrower | Loan Amount |
|---|---|---|---|
| Previous Owner | Not Available | $72,000 |
Source: Public Records
Tax History
| Year | Tax Paid | Tax Assessment Tax Assessment Total Assessment is a certain percentage of the fair market value that is determined by local assessors to be the total taxable value of land and additions on the property. | Land | Improvement |
|---|---|---|---|---|
| 2025 | $695 | $37,100 | $5,000 | $32,100 |
| 2024 | $695 | $37,100 | $5,000 | $32,100 |
| 2022 | $695 | $37,100 | $5,000 | $32,100 |
| 2021 | $545 | $23,175 | $3,150 | $20,025 |
| 2020 | $545 | $23,175 | $3,150 | $20,025 |
| 2019 | $545 | $23,175 | $3,150 | $20,025 |
| 2018 | $545 | $23,175 | $3,150 | $20,025 |
| 2017 | $549 | $22,400 | $3,150 | $19,250 |
| 2016 | $482 | $22,400 | $3,150 | $19,250 |
| 2015 | $482 | $22,400 | $3,150 | $19,250 |
| 2014 | $482 | $22,400 | $3,150 | $19,250 |
Source: Public Records
Map
Nearby Homes
- 91 McGee Loop
- 99 Hidden Valley Dr
- 24 Palmetto Cove
- 0 Red Gum Ln & Old Medina Crossing Ln Unit 10195533
- 2888 Old Medina Rd
- 31 Mack St
- 85 Old Medina Crossing
- 111 Henderson Rd
- 21 Bluebird Cove
- 0 Interstate 40 Unit 2505648
- 0 Interstate 40
- 0 U S Highway 412
- 62 Beth Place
- 53 Jackson Creek Dr
- 130 Cooper Anderson Rd
- 5 Brentmeade Cove
- 130 Campbell Oaks Dr
- 34 Baymeadows Dr
- 32 Kingston Creek Dr
- 189 Valley Oak Loop
- 122 McGee Loop
- 138 McGee Loop
- 114 McGee Loop
- 131 McGee Loop
- 139 McGee Loop
- 123 McGee Loop
- 144 McGee Loop
- 115 McGee Loop
- 106 McGee Loop
- 151 McGee Loop
- 107 McGee Loop
- 168 McGee Loop
- 122 Hidden Valley Dr
- 159 McGee Loop
- 114 Hidden Valley Dr
- 98 McGee Loop
- 99 McGee Loop
- 167 McGee Loop
- 106 Hidden Valley Dr
- 90 McGee Loop
Your Personal Tour Guide
Ask me questions while you tour the home.