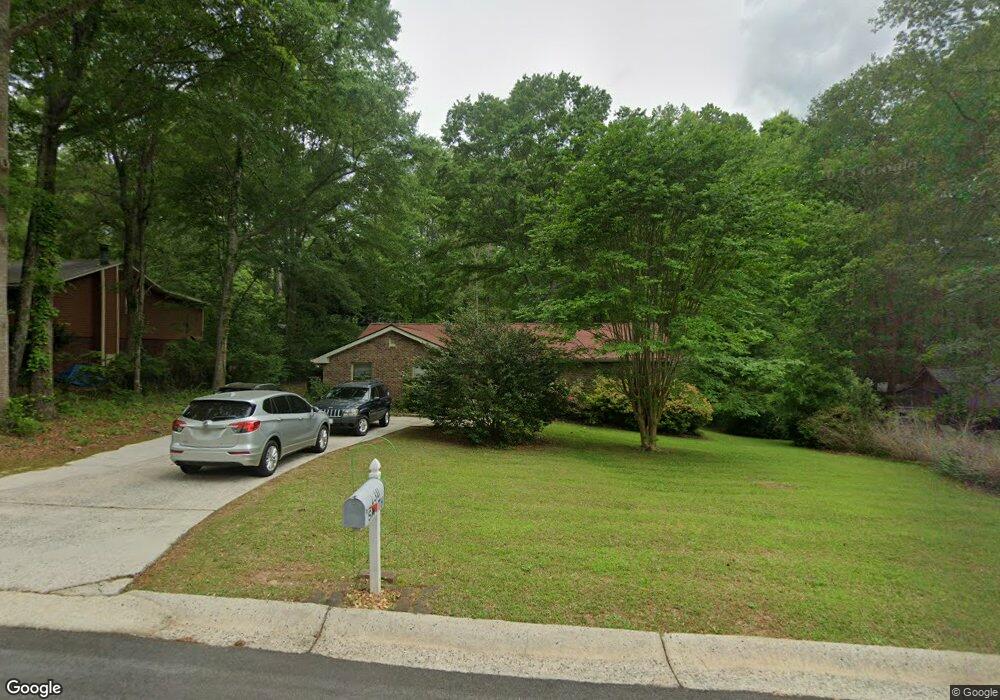
130 Meadowview Cir Tyrone, GA 30290
Estimated Value: $256,000 - $276,000
Studio
1
Bath
1,350
Sq Ft
$197/Sq Ft
Est. Value
About This Home
This home is located at 130 Meadowview Cir, Tyrone, GA 30290 and is currently estimated at $266,429, approximately $197 per square foot. 130 Meadowview Cir is a home located in Fayette County with nearby schools including Crabapple Lane Elementary School, Flat Rock Middle School, and Sandy Creek High School.
Ownership History
Date
Name
Owned For
Owner Type
Purchase Details
Closed on
Feb 22, 2021
Sold by
Brown Donald
Bought by
Brown Jacqueline
Current Estimated Value
Purchase Details
Closed on
Aug 28, 2013
Sold by
Greenwalt Alicia Goen
Bought by
Brown Donald R and Brown Georgia M
Purchase Details
Closed on
Nov 9, 1995
Sold by
Degen Steve
Bought by
Goen Sara
Purchase Details
Closed on
Aug 1, 1994
Sold by
Federal National Mortgage Association
Bought by
Degan Steve M
Home Financials for this Owner
Home Financials are based on the most recent Mortgage that was taken out on this home.
Original Mortgage
$69,350
Interest Rate
7.25%
Purchase Details
Closed on
Jun 7, 1994
Sold by
Philmon Michael and Philmon Janet
Bought by
Federal National Mortgage Association
Home Financials for this Owner
Home Financials are based on the most recent Mortgage that was taken out on this home.
Original Mortgage
$69,350
Interest Rate
7.25%
Create a Home Valuation Report for This Property
The Home Valuation Report is an in-depth analysis detailing your home's value as well as a comparison with similar homes in the area
Home Values in the Area
Average Home Value in this Area
Purchase History
We collect this data history from publicly available records. To have your information removed, we recommend requesting removal directly through your county’s website.
| Date | Buyer | Sale Price | Title Company |
|---|---|---|---|
| Brown Jacqueline | -- | None Listed On Document | |
| Brown Jacqueline | -- | -- | |
| Brown Donald R | $82,000 | -- | |
| Goen Sara | $85,000 | -- | |
| Degan Steve M | -- | -- | |
| Federal National Mortgage Association | $68,100 | -- |
Source: Public Records
Mortgage History
We collect this data history from publicly available records. To have your information removed, we recommend requesting removal directly through your county’s website.
| Date | Status | Borrower | Loan Amount |
|---|---|---|---|
| Previous Owner | Degan Steve M | $69,350 |
Source: Public Records
Tax History
| Year | Tax Paid | Tax Assessment Tax Assessment Total Assessment is a certain percentage of the fair market value that is determined by local assessors to be the total taxable value of land and additions on the property. | Land | Improvement |
|---|---|---|---|---|
| 2025 | $3,443 | $122,121 | $22,812 | $99,309 |
| 2024 | $3,428 | $114,132 | $21,320 | $92,812 |
| 2023 | $3,369 | $109,560 | $21,320 | $88,240 |
| 2022 | $2,827 | $92,080 | $12,600 | $79,480 |
| 2021 | $2,042 | $65,680 | $12,600 | $53,080 |
| 2020 | $1,889 | $60,480 | $12,600 | $47,880 |
| 2019 | $1,736 | $55,040 | $12,600 | $42,440 |
| 2018 | $1,607 | $50,440 | $12,600 | $37,840 |
| 2017 | $1,557 | $48,680 | $12,600 | $36,080 |
| 2016 | $1,427 | $43,720 | $12,600 | $31,120 |
| 2015 | $1,360 | $40,960 | $12,600 | $28,360 |
| 2014 | $1,108 | $32,800 | $11,440 | $21,360 |
| 2013 | -- | $35,160 | $0 | $0 |
Source: Public Records
Map
Nearby Homes
- 125 Meadowview Cir
- 240 Northwood Rd
- 1.00 Briarwood Rd
- 115 Westmont Way
- 131 Lincoln Rd
- 535 Laurelwood Dr
- 101 Green Branch Dr
- 230 Ridge Rd
- 109 Hampshire Trace
- 0 Georgia 74
- 0 Erwin Run Unit 10585589
- 222 Lincoln Rd
- 110 Foster Ln
- 105 Laurel Forest Dr
- 129 Valleywood Rd
- 215 Handley Ct
- 225 Handley Ct
- 200 Chaparral Trace
- 2080 Castle Lake Dr
- 135 London Berry Ct
- 130 Meadowview Cir
- 220 Meadowview Cir
- 140 Meadowview Cir Unit 14
- 140 Meadowview Cir
- 218 Meadowview Cir
- 115 Meadowview Cir
- 115 Meadowview Cir
- 150 Meadowview Cir
- 150 Meadowview Cir
- 125 Meadowview Cir Unit 2
- 216 Meadowview Cir
- 216 Meadowview Cir Unit 149
- 200 Meadowview Dr
- 155 Meadowview Dr
- 205 Wildwood Ct
- 195 Wildwood Ct
- 100 Oakhurst Dr Unit 2
- 215 Meadowview Cir
- 160 Meadowview Dr
- 145 Meadowview Cir
Your Personal Tour Guide
Ask me questions while you tour the home.