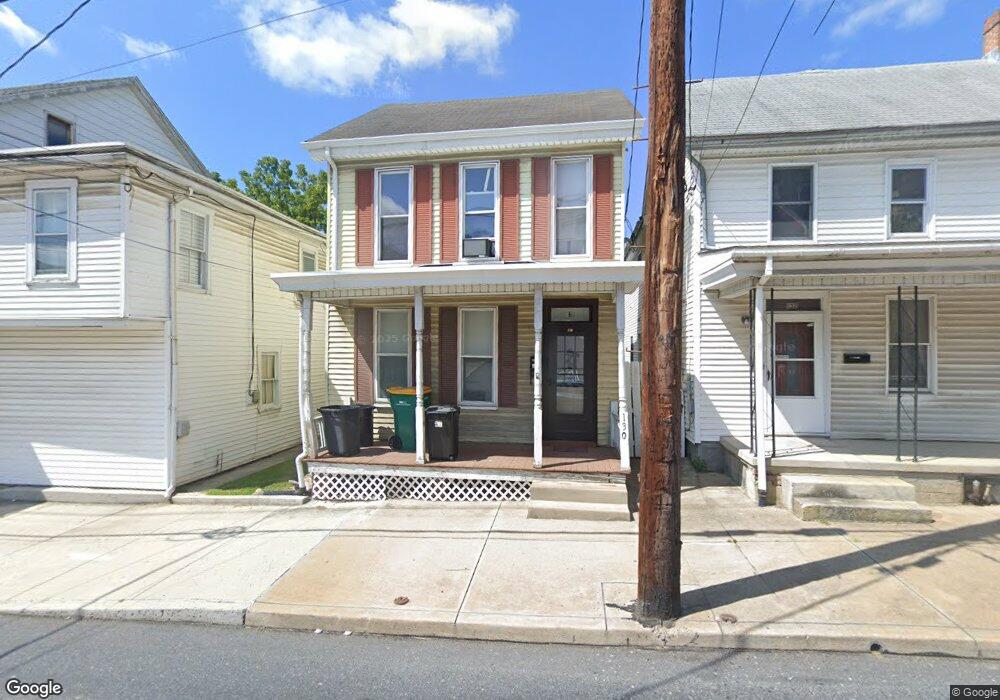
130 N Church St Waynesboro, PA 17268
Estimated Value: $113,618 - $224,000
4
Beds
2
Baths
1,512
Sq Ft
$110/Sq Ft
Est. Value
About This Home
This home is located at 130 N Church St, Waynesboro, PA 17268 and is currently estimated at $166,155, approximately $109 per square foot. 130 N Church St is a home located in Franklin County with nearby schools including Waynesboro Area Senior High School, St. Andrew Catholic School, and Noah's Ark Christian Child Care Center.
Ownership History
Date
Name
Owned For
Owner Type
Purchase Details
Closed on
Mar 11, 2016
Sold by
Fissel Sarah
Bought by
Fissel Shawn D
Current Estimated Value
Purchase Details
Closed on
Oct 29, 2010
Sold by
Mace Jeffery L and Mace Nancy B
Bought by
Fissel Shawn D and Fissel Sarah
Home Financials for this Owner
Home Financials are based on the most recent Mortgage that was taken out on this home.
Original Mortgage
$78,937
Outstanding Balance
$55,244
Interest Rate
5.5%
Mortgage Type
FHA
Estimated Equity
$110,911
Purchase Details
Closed on
Jan 27, 2010
Sold by
Fannie Mae
Bought by
Mace Jeffrey L and Mace Nancy B
Purchase Details
Closed on
Oct 6, 2009
Sold by
Ridenour Angie S and Sullivan Matthew B
Bought by
Federal National Mortgage Association
Create a Home Valuation Report for This Property
The Home Valuation Report is an in-depth analysis detailing your home's value as well as a comparison with similar homes in the area
Home Values in the Area
Average Home Value in this Area
Purchase History
| Date | Buyer | Sale Price | Title Company |
|---|---|---|---|
| Fissel Shawn D | -- | None Available | |
| Fissel Shawn D | $80,000 | None Available | |
| Mace Jeffrey L | $35,000 | None Available | |
| Federal National Mortgage Association | $1,700 | None Available |
Source: Public Records
Mortgage History
| Date | Status | Borrower | Loan Amount |
|---|---|---|---|
| Open | Fissel Shawn D | $78,937 |
Source: Public Records
Tax History Compared to Growth
Tax History
| Year | Tax Paid | Tax Assessment Tax Assessment Total Assessment is a certain percentage of the fair market value that is determined by local assessors to be the total taxable value of land and additions on the property. | Land | Improvement |
|---|---|---|---|---|
| 2025 | $1,283 | $7,080 | $730 | $6,350 |
| 2024 | $1,251 | $7,080 | $730 | $6,350 |
| 2023 | $1,224 | $7,080 | $730 | $6,350 |
| 2022 | $1,185 | $7,080 | $730 | $6,350 |
| 2021 | $1,125 | $7,080 | $730 | $6,350 |
| 2020 | $1,116 | $7,080 | $730 | $6,350 |
| 2019 | $1,095 | $7,080 | $730 | $6,350 |
| 2018 | $1,033 | $7,080 | $730 | $6,350 |
| 2017 | $1,013 | $7,080 | $730 | $6,350 |
| 2016 | $203 | $7,080 | $730 | $6,350 |
| 2015 | $189 | $7,080 | $730 | $6,350 |
| 2014 | $189 | $7,080 | $730 | $6,350 |
Source: Public Records
Map
Nearby Homes
- 110 N Church St
- 112 N Church St
- 7 Mount Airy Ave
- 50 E North St
- 53 E North St
- Frankford Plan at Pheasant Run
- Ruby Plan at Pheasant Run
- Pearl Plan at Pheasant Run
- Emerald Plan at Pheasant Run
- Hanover Plan at Pheasant Run
- Avondale Plan at Pheasant Run
- Hamilton Plan at Pheasant Run
- Topaz Plan at Pheasant Run
- Bradford Plan at Pheasant Run
- Sussex Plan at Pheasant Run
- Bristol II Plan at Pheasant Run
- Opal Plan at Pheasant Run
- Roosevelt Plan at Pheasant Run
- 0 N Church St Unit PAFL2029878
- 0 N Church St Unit PAFL2027222
- 132 N Church St
- 134 N Church St
- 150 N Church St
- 138 N Church St
- 122 N Church St
- 131 N Church St
- 120 N Church St
- 140 N Church St Unit A
- 140 N Church St
- 140 N Church St Unit 2ND FLOOR
- 140 N Church St Unit 1ST FLOOR
- 137 N Church St
- 139 N Church St
- 133 N Church St
- 125 N Church St
- 118 N Church St
- 127 N Church St
- 121 N Church St
- 121 N Church St
- 141 N Church St Unit 1