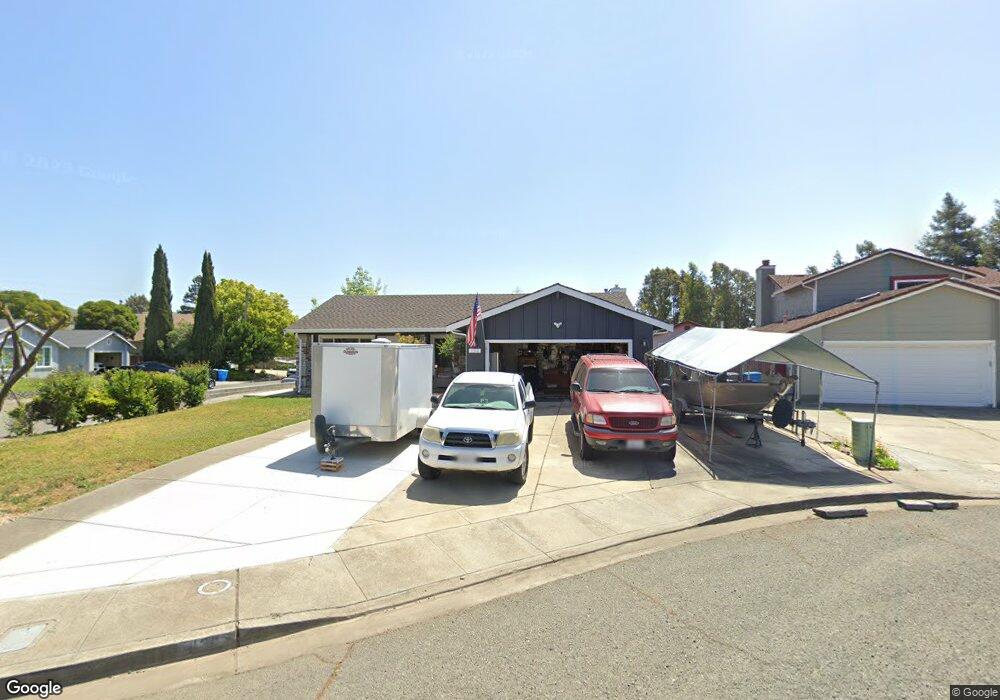
130 Poppy Ct Vallejo, CA 94591
Estimated Value: $546,000 - $660,000
4
Beds
2
Baths
1,644
Sq Ft
$369/Sq Ft
Est. Value
About This Home
This home is located at 130 Poppy Ct, Vallejo, CA 94591 and is currently estimated at $605,906, approximately $368 per square foot. 130 Poppy Ct is a home located in Solano County with nearby schools including Annie Pennycook Elementary School, Jesse M. Bethel High School, and Vallejo Charter School.
Ownership History
Date
Name
Owned For
Owner Type
Purchase Details
Closed on
Jun 3, 2000
Sold by
Clelland William C
Bought by
Clelland William C and Denton Michelle S
Current Estimated Value
Purchase Details
Closed on
Apr 27, 1999
Sold by
Bertha Lopez and Lopez Roberta
Bought by
Clelland William C
Home Financials for this Owner
Home Financials are based on the most recent Mortgage that was taken out on this home.
Original Mortgage
$133,200
Interest Rate
6.98%
Purchase Details
Closed on
Oct 27, 1995
Sold by
Ramirez Henry C and Ramirez Enrique N
Bought by
Lopez Bertha and Lopez Roberta
Home Financials for this Owner
Home Financials are based on the most recent Mortgage that was taken out on this home.
Original Mortgage
$96,250
Interest Rate
7.58%
Purchase Details
Closed on
Oct 10, 1995
Sold by
Lopez Robert
Bought by
Lopez Bertha
Home Financials for this Owner
Home Financials are based on the most recent Mortgage that was taken out on this home.
Original Mortgage
$96,250
Interest Rate
7.58%
Create a Home Valuation Report for This Property
The Home Valuation Report is an in-depth analysis detailing your home's value as well as a comparison with similar homes in the area
Home Values in the Area
Average Home Value in this Area
Purchase History
| Date | Buyer | Sale Price | Title Company |
|---|---|---|---|
| Clelland William C | -- | -- | |
| Clelland William C | $166,500 | North American Title Co | |
| Lopez Bertha | $137,500 | North American Title Co | |
| Lopez Bertha | -- | North American Title Co |
Source: Public Records
Mortgage History
| Date | Status | Borrower | Loan Amount |
|---|---|---|---|
| Previous Owner | Clelland William C | $133,200 | |
| Previous Owner | Lopez Bertha | $96,250 |
Source: Public Records
Tax History Compared to Growth
Tax History
| Year | Tax Paid | Tax Assessment Tax Assessment Total Assessment is a certain percentage of the fair market value that is determined by local assessors to be the total taxable value of land and additions on the property. | Land | Improvement |
|---|---|---|---|---|
| 2025 | $4,221 | $278,007 | $78,379 | $199,628 |
| 2024 | $4,221 | $272,557 | $76,843 | $195,714 |
| 2023 | $3,970 | $267,214 | $75,337 | $191,877 |
| 2022 | $3,871 | $261,975 | $73,861 | $188,114 |
| 2021 | $3,784 | $256,839 | $72,413 | $184,426 |
| 2020 | $3,795 | $254,206 | $71,671 | $182,535 |
| 2019 | $3,676 | $249,222 | $70,266 | $178,956 |
| 2018 | $3,440 | $244,337 | $68,889 | $175,448 |
| 2017 | $3,284 | $239,547 | $67,539 | $172,008 |
| 2016 | $2,712 | $234,851 | $66,215 | $168,636 |
| 2015 | $2,675 | $231,324 | $65,221 | $166,103 |
| 2014 | $2,636 | $226,794 | $63,944 | $162,850 |
Source: Public Records
Map
Nearby Homes
- 124 Hydrangea Ct
- 118 Hydrangea Ct
- 1275 Granada St
- 1163 Granada St
- 1155 Granada St
- 108 Sunnyglen Dr
- Plan 7 at Cascade at Waterstone
- Plan 3 at Cascade at Waterstone
- Plan 1 at Cascade at Waterstone
- Plan 2 at Cascade at Waterstone
- Plan 4 at Cascade at Waterstone
- Plan 6 at Cascade at Waterstone
- 115 Lands End Ct Unit 26
- 1406 Granada St
- 8091 Waterfall Ln
- 1442 Granada St
- 8078 Waterfall Ln
- 112 Aragon Ct
- 8649 Rockaway Dr
- 127 Seville St
- 120 Poppy Ct
- 521 Greenmont Dr
- 530 Greenmont Dr
- 540 Greenmont Dr
- 110 Poppy Ct
- 520 Greenmont Dr
- 131 Poppy Ct
- 511 Greenmont Dr
- 121 Poppy Ct
- 600 Greenmont Dr
- 111 Poppy Ct
- 500 Greenmont Dr
- 106 Hydrangea Ct
- 501 Greenmont Dr
- 107 Oleander Ct
- 610 Greenmont Dr
- 100 Daffodil Cir
- 106 Daffodil Cir
- 113 Oleander Ct
- 441 Greenmont Dr