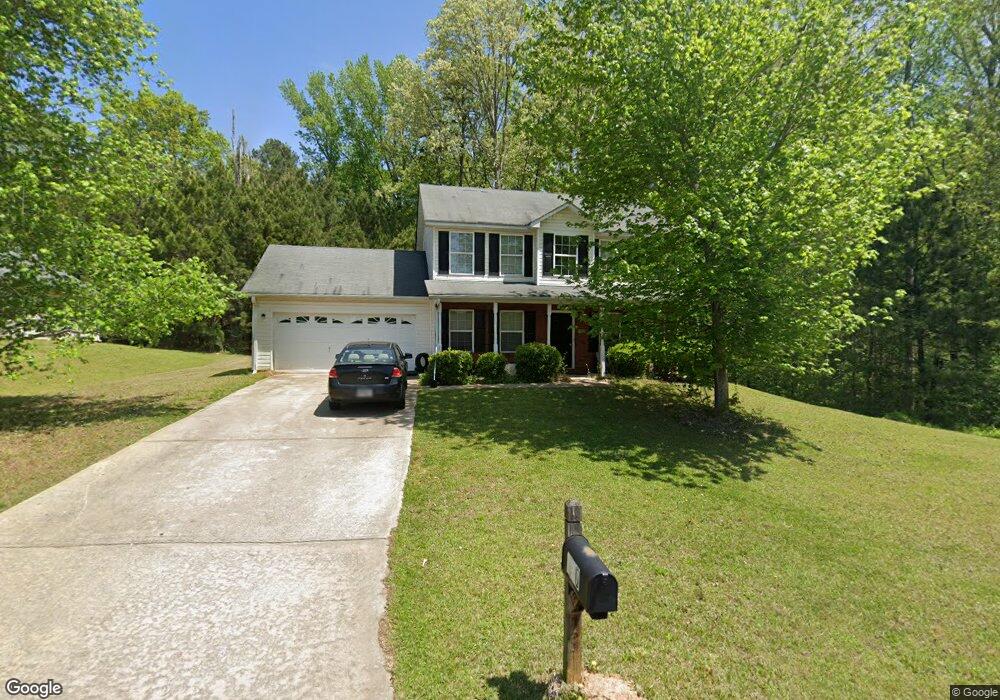
130 Railside Dr Covington, GA 30014
Estimated Value: $266,000 - $302,000
3
Beds
3
Baths
1,591
Sq Ft
$174/Sq Ft
Est. Value
About This Home
This home is located at 130 Railside Dr, Covington, GA 30014 and is currently estimated at $277,213, approximately $174 per square foot. 130 Railside Dr is a home located in Newton County with nearby schools including Heard-Mixon Elementary School, Cousins Middle School, and Eastside High School.
Ownership History
Date
Name
Owned For
Owner Type
Purchase Details
Closed on
Dec 10, 2021
Sold by
Joseph Shea Llc
Bought by
Rs Rental Ii Llc
Current Estimated Value
Purchase Details
Closed on
Dec 18, 2020
Sold by
Lhp Spe Llc
Bought by
Joseph Shea Llc
Purchase Details
Closed on
Jan 21, 2015
Sold by
Lunsford House Properties Llc
Bought by
Lhp Spe Llc
Purchase Details
Closed on
Jul 5, 2011
Sold by
Hud-Housing Of Urban Dev
Bought by
Lunsford House Properties Llc
Purchase Details
Closed on
Jul 6, 2010
Sold by
Bank Of America
Bought by
Hud-Housing Of Urban Dev
Purchase Details
Closed on
Apr 27, 2007
Sold by
R & B Const Inc
Bought by
Williams Robert L
Home Financials for this Owner
Home Financials are based on the most recent Mortgage that was taken out on this home.
Original Mortgage
$136,521
Interest Rate
6.1%
Mortgage Type
FHA
Create a Home Valuation Report for This Property
The Home Valuation Report is an in-depth analysis detailing your home's value as well as a comparison with similar homes in the area
Home Values in the Area
Average Home Value in this Area
Purchase History
| Date | Buyer | Sale Price | Title Company |
|---|---|---|---|
| Rs Rental Ii Llc | $175,774 | -- | |
| Joseph Shea Llc | -- | -- | |
| Lhp Spe Llc | -- | -- | |
| Lunsford House Properties Llc | -- | -- | |
| Hud-Housing Of Urban Dev | -- | -- | |
| Bank Of America | $164,515 | -- | |
| Williams Robert L | $140,500 | -- |
Source: Public Records
Mortgage History
| Date | Status | Borrower | Loan Amount |
|---|---|---|---|
| Previous Owner | Williams Robert L | $136,521 |
Source: Public Records
Tax History Compared to Growth
Tax History
| Year | Tax Paid | Tax Assessment Tax Assessment Total Assessment is a certain percentage of the fair market value that is determined by local assessors to be the total taxable value of land and additions on the property. | Land | Improvement |
|---|---|---|---|---|
| 2024 | $2,884 | $111,000 | $15,200 | $95,800 |
| 2023 | $2,831 | $101,680 | $6,400 | $95,280 |
| 2022 | $2,312 | $82,560 | $6,400 | $76,160 |
| 2021 | $2,174 | $69,320 | $6,400 | $62,920 |
| 2020 | $1,894 | $54,280 | $6,400 | $47,880 |
| 2019 | $1,639 | $46,000 | $6,400 | $39,600 |
| 2018 | $1,302 | $35,880 | $5,000 | $30,880 |
| 2017 | $1,315 | $36,240 | $3,800 | $32,440 |
| 2016 | $1,315 | $36,240 | $3,800 | $32,440 |
| 2015 | $1,221 | $33,560 | $3,200 | $30,360 |
| 2014 | $1,217 | $33,560 | $0 | $0 |
Source: Public Records
Map
Nearby Homes
- 72 Woodfield Rd
- 10717 Georgia 36
- 13262 Tolstoy Dr
- 95 Woodfield Rd
- 30 Woodfield Rd
- 75 Woodfield Rd
- 240 Kestrel Cir
- 20 Mariposa Place
- 210 Kestrel Cir
- 205 Kestrel Cir
- 352 River Walk Farm
- 368 River Walk Farm Unit LOT 70
- 345 River Walk Farm
- 345 River Walk Farm Unit LOT 5
- 30 Snapdragon Ln
- 370 Granary Walk
- Tucker Plan at River Walk Farm
- Jodeco 2 Story Bay Plan at River Walk Farm
- Jodeco Front Porch Plan at River Walk Farm
- Hemingway Plan at River Walk Farm
- 140 Railside Dr
- 120 Railside Dr
- 15 Carver Dr
- 150 Railside Dr
- 110 Railside Dr
- 20 Scarlett Ct
- 155 Railside Dr
- 0 Scarlett Ct Unit 7182666
- 35 Carver Dr
- 100 Railside Dr
- 20 Carver Dr
- 115 Railside Dr
- 25 Scarlett Ct
- 160 Railside Dr
- 0 Railside Dr Unit 7405356
- 0 Railside Dr Unit 7267841
- 0 Railside Dr Unit 7068612
- 0 Railside Dr Unit 8828803
- 0 Railside Dr Unit 8667689
- 0 Railside Dr Unit 8435771