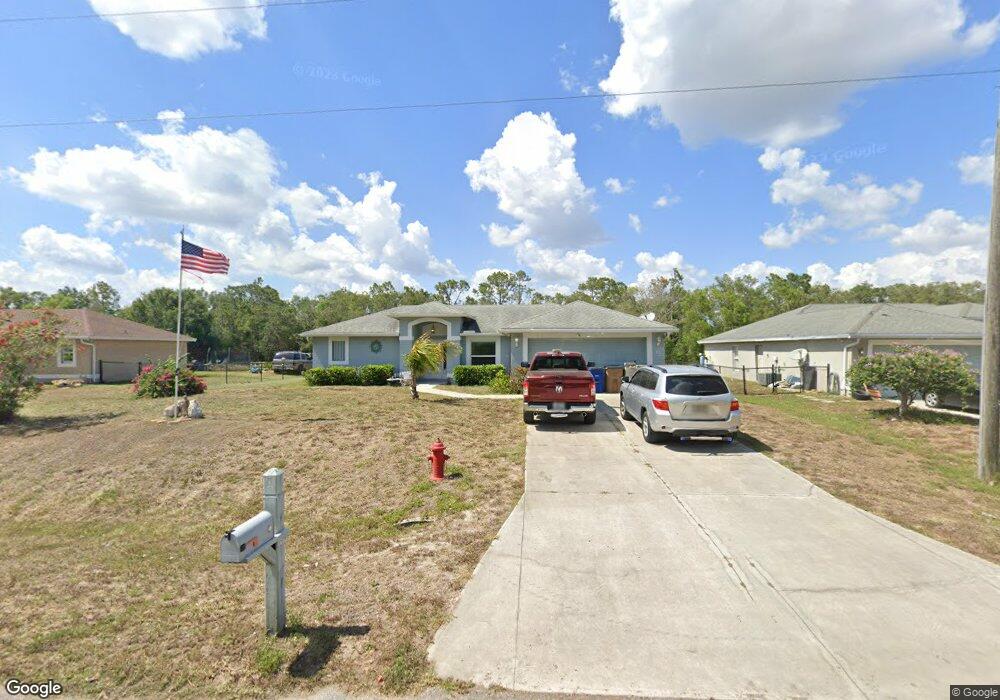
130 Ridgemont Dr Lehigh Acres, FL 33972
Joel NeighborhoodEstimated Value: $216,000 - $342,000
3
Beds
2
Baths
1,637
Sq Ft
$177/Sq Ft
Est. Value
About This Home
This home is located at 130 Ridgemont Dr, Lehigh Acres, FL 33972 and is currently estimated at $289,993, approximately $177 per square foot. 130 Ridgemont Dr is a home located in Lee County with nearby schools including The Alva School, Lehigh Elementary School, and Orange River Elementary School.
Ownership History
Date
Name
Owned For
Owner Type
Purchase Details
Closed on
Jun 22, 2017
Sold by
Cox Edward A and Cox Jayne E
Bought by
Cox Edward A and Cox Jayne E
Current Estimated Value
Purchase Details
Closed on
Oct 14, 2010
Sold by
Federal National Mortgage Association
Bought by
Cox Edward A and Cox Jayne E
Purchase Details
Closed on
Oct 13, 2010
Sold by
Suntrust Mortgage Inc
Bought by
Federal National Mortgage Association
Purchase Details
Closed on
Sep 8, 2010
Sold by
Rybackk Lucila Correa Zapata
Bought by
Suntrust Mortgage Inc
Purchase Details
Closed on
Jul 21, 2006
Sold by
U S Home Corp
Bought by
Ryback Ralph and Ryback Lucila Correa Zapata
Home Financials for this Owner
Home Financials are based on the most recent Mortgage that was taken out on this home.
Original Mortgage
$180,700
Interest Rate
6.71%
Mortgage Type
Unknown
Create a Home Valuation Report for This Property
The Home Valuation Report is an in-depth analysis detailing your home's value as well as a comparison with similar homes in the area
Home Values in the Area
Average Home Value in this Area
Purchase History
| Date | Buyer | Sale Price | Title Company |
|---|---|---|---|
| Cox Edward A | -- | Attorney | |
| Cox Edward A | $47,500 | Attorney | |
| Federal National Mortgage Association | -- | Watson Title Ins Agency Inc | |
| Suntrust Mortgage Inc | -- | None Available | |
| Ryback Ralph | $241,000 | North American Title Company |
Source: Public Records
Mortgage History
| Date | Status | Borrower | Loan Amount |
|---|---|---|---|
| Previous Owner | Ryback Ralph | $180,700 |
Source: Public Records
Tax History Compared to Growth
Tax History
| Year | Tax Paid | Tax Assessment Tax Assessment Total Assessment is a certain percentage of the fair market value that is determined by local assessors to be the total taxable value of land and additions on the property. | Land | Improvement |
|---|---|---|---|---|
| 2025 | $1,577 | $116,305 | -- | -- |
| 2024 | $1,575 | $113,027 | -- | -- |
| 2023 | $1,575 | $104,735 | $0 | $0 |
| 2022 | $1,419 | $103,437 | $0 | $0 |
| 2021 | $1,332 | $166,508 | $3,900 | $162,608 |
| 2020 | $1,322 | $99,037 | $0 | $0 |
| 2019 | $1,071 | $96,810 | $0 | $0 |
| 2018 | $1,049 | $95,005 | $0 | $0 |
| 2017 | $1,014 | $93,051 | $0 | $0 |
| 2016 | $989 | $112,508 | $3,700 | $108,808 |
| 2015 | $995 | $90,503 | $2,640 | $87,863 |
| 2014 | -- | $92,102 | $2,540 | $89,562 |
| 2013 | -- | $72,207 | $2,300 | $69,907 |
Source: Public Records
Map
Nearby Homes
- 139 Sanborn Dr
- 130 Sanborn Dr
- 128 Sanborn Dr
- 131 Sanborn Dr
- 2138 Wyandotte Ave
- 2192 Wyandotte Ave
- 2007 Welby Ln
- 116 Ridgemont Dr
- 134 Sanborn Dr
- 2011 Mill St
- 2189 Lincoln Park Ave
- 2008 Yuma Ct
- 133 Greenbriar Blvd
- 130 Viewpoint Dr
- 123 Greenbriar Blvd
- 2004 Rosa Ct
- 2005 Rosa Ct
- 148 Viewpoint Dr
- 2102 Edward Ave
- 2084 W Lansing Cir
- 128 Ridgemont Dr
- 132 Ridgemont Dr
- 126 Ridgemont Dr Unit 1
- 134 Ridgemont Dr
- 124 Ridgemont Dr
- 136 Ridgemont Dr
- 141 Sanborn Dr
- 2184 Wyandotte Ave
- 122 Ridgemont Dr
- 120 Ridgemont Dr
- 2182 Wyandotte Ave
- 137 Sanborn Dr
- 138 Ridgemont Dr
- 2008 Welby Ln
- 2178 Wyandotte Ave
- 118 Ridgemont Dr
- 133 Sanborn Dr
- 2006 Welby Ln
- 140 Ridgemont Dr
- 2168 Wyandotte Ave