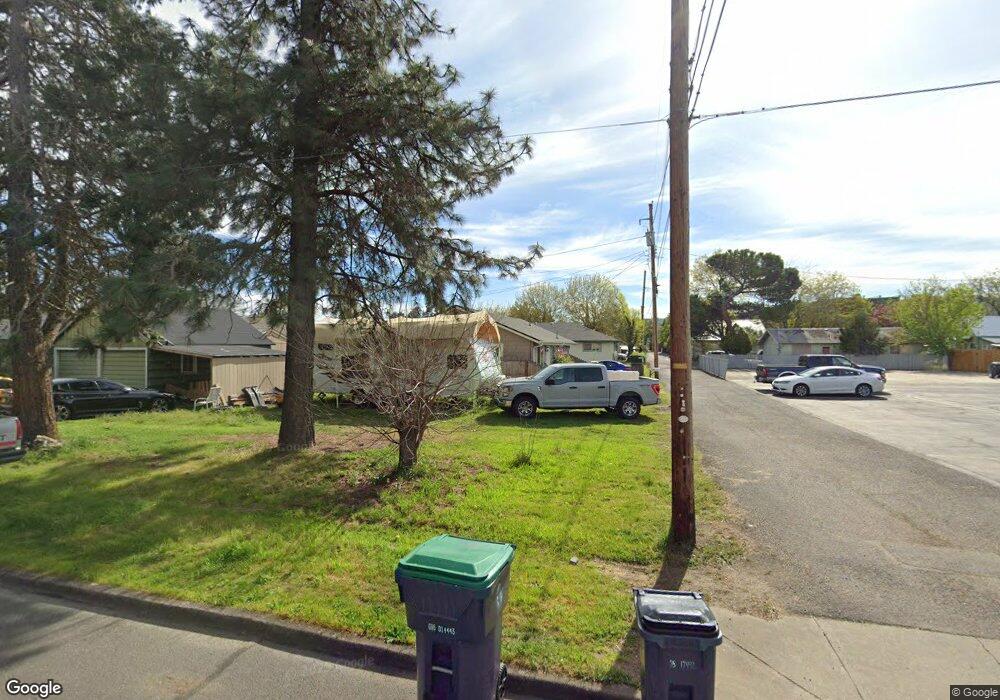
130 S 5th St Central Point, OR 97502
Estimated Value: $254,320 - $290,000
2
Beds
1
Bath
884
Sq Ft
$307/Sq Ft
Est. Value
About This Home
This home is located at 130 S 5th St, Central Point, OR 97502 and is currently estimated at $271,580, approximately $307 per square foot. 130 S 5th St is a home located in Jackson County with nearby schools including Central Point Elementary School, Scenic Middle School, and Crater High School.
Ownership History
Date
Name
Owned For
Owner Type
Purchase Details
Closed on
Oct 15, 2008
Sold by
Yonker Michael B
Bought by
Lundgren Kyle K
Current Estimated Value
Home Financials for this Owner
Home Financials are based on the most recent Mortgage that was taken out on this home.
Original Mortgage
$105,300
Outstanding Balance
$67,765
Interest Rate
5.77%
Mortgage Type
FHA
Estimated Equity
$203,815
Purchase Details
Closed on
Feb 8, 2008
Sold by
Federal National Mortgage Association
Bought by
Yonker Michael B
Purchase Details
Closed on
Oct 12, 2007
Sold by
Klassen Cole L and Klassen Sarra R
Bought by
Federal National Mortgage Association
Purchase Details
Closed on
Mar 23, 2005
Sold by
Savage Donald J and Savage Mary R
Bought by
Klassen Cole L and Klassen Sarra R
Home Financials for this Owner
Home Financials are based on the most recent Mortgage that was taken out on this home.
Original Mortgage
$115,000
Interest Rate
5.53%
Mortgage Type
Purchase Money Mortgage
Create a Home Valuation Report for This Property
The Home Valuation Report is an in-depth analysis detailing your home's value as well as a comparison with similar homes in the area
Home Values in the Area
Average Home Value in this Area
Purchase History
| Date | Buyer | Sale Price | Title Company |
|---|---|---|---|
| Lundgren Kyle K | $140,000 | Lawyers Title Ins | |
| Yonker Michael B | $105,000 | Ticor Title | |
| Federal National Mortgage Association | $145,919 | None Available | |
| Klassen Cole L | $143,750 | First American Title Co |
Source: Public Records
Mortgage History
| Date | Status | Borrower | Loan Amount |
|---|---|---|---|
| Open | Lundgren Kyle K | $105,300 | |
| Previous Owner | Klassen Cole L | $115,000 |
Source: Public Records
Tax History Compared to Growth
Tax History
| Year | Tax Paid | Tax Assessment Tax Assessment Total Assessment is a certain percentage of the fair market value that is determined by local assessors to be the total taxable value of land and additions on the property. | Land | Improvement |
|---|---|---|---|---|
| 2025 | $1,844 | $110,900 | $37,930 | $72,970 |
| 2024 | $1,844 | $107,670 | $36,830 | $70,840 |
| 2023 | $1,785 | $104,540 | $35,760 | $68,780 |
| 2022 | $1,743 | $104,540 | $35,760 | $68,780 |
| 2021 | $1,693 | $101,500 | $34,710 | $66,790 |
| 2020 | $1,644 | $98,550 | $33,700 | $64,850 |
| 2019 | $1,603 | $92,900 | $31,760 | $61,140 |
| 2018 | $1,555 | $90,200 | $30,840 | $59,360 |
| 2017 | $1,516 | $90,200 | $30,840 | $59,360 |
| 2016 | $1,471 | $85,030 | $29,070 | $55,960 |
| 2015 | $1,410 | $85,030 | $29,070 | $55,960 |
| 2014 | $1,374 | $80,160 | $27,410 | $52,750 |
Source: Public Records
Map
Nearby Homes
- 350 Alder St
- 715 Ash St
- 114 Cedar St
- 144 N 5th St
- 340 Freeman Rd
- 546 Laurel St
- 531 Bush St
- 840 Ash St
- 845 Manzanita St
- 555 Freeman Rd Unit 128
- 555 Freeman Rd Unit 146
- 555 Freeman Rd Unit 204
- 555 Freeman Rd Unit 209
- 431 N 5th St
- 755 S 4th St
- 448 Cheney Loop
- 342 Hazel St
- 301 Freeman Rd Unit 100
- 301 Freeman Rd Unit 23
- 301 Freeman Rd Unit 85