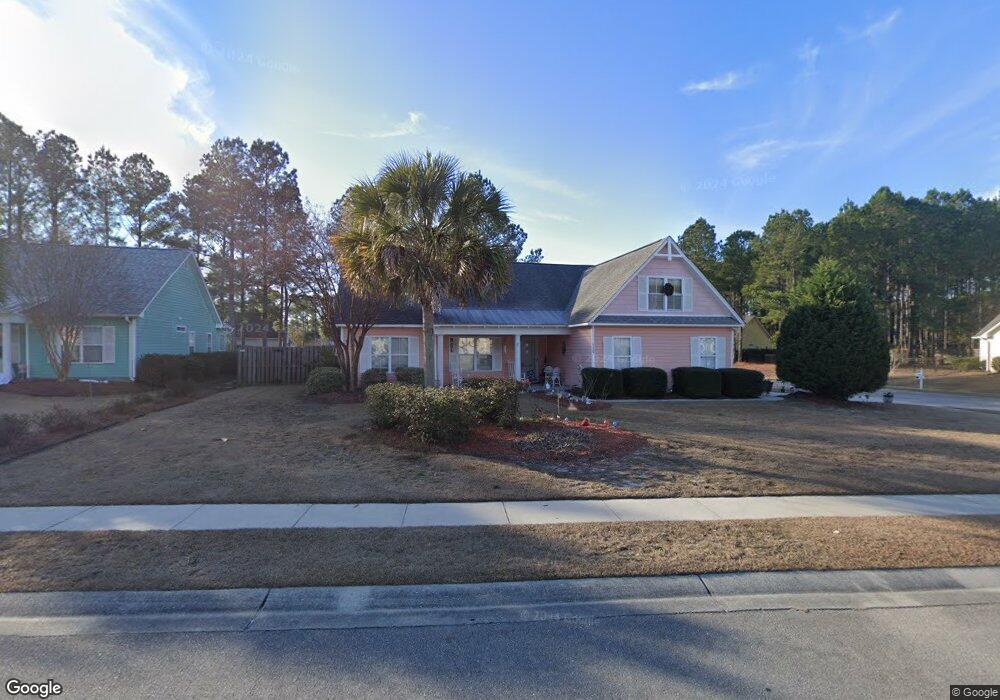
130 S Palm Dr Winnabow, NC 28479
Estimated Value: $360,000 - $370,000
4
Beds
2
Baths
1,770
Sq Ft
$205/Sq Ft
Est. Value
About This Home
This home is located at 130 S Palm Dr, Winnabow, NC 28479 and is currently estimated at $363,470, approximately $205 per square foot. 130 S Palm Dr is a home located in Brunswick County with nearby schools including Belville Elementary School, Leland Middle School, and North Brunswick High School.
Ownership History
Date
Name
Owned For
Owner Type
Purchase Details
Closed on
Nov 20, 2020
Sold by
Hatcher Tinea C
Bought by
Hatcher Mary F
Current Estimated Value
Purchase Details
Closed on
Jul 30, 2010
Sold by
Siebold David S and Siebold Amelia C
Bought by
Hatcher Tinea
Home Financials for this Owner
Home Financials are based on the most recent Mortgage that was taken out on this home.
Original Mortgage
$171,780
Outstanding Balance
$114,706
Interest Rate
4.74%
Mortgage Type
FHA
Estimated Equity
$248,764
Purchase Details
Closed on
Jun 20, 2005
Sold by
Stevens Limited Llc
Bought by
Siebold David S and Siebold Amelia C
Home Financials for this Owner
Home Financials are based on the most recent Mortgage that was taken out on this home.
Original Mortgage
$148,096
Interest Rate
5.7%
Mortgage Type
New Conventional
Create a Home Valuation Report for This Property
The Home Valuation Report is an in-depth analysis detailing your home's value as well as a comparison with similar homes in the area
Home Values in the Area
Average Home Value in this Area
Purchase History
| Date | Buyer | Sale Price | Title Company |
|---|---|---|---|
| Hatcher Mary F | -- | None Available | |
| Hatcher Tinea | $180,000 | None Available | |
| Siebold David S | $185,500 | None Available |
Source: Public Records
Mortgage History
| Date | Status | Borrower | Loan Amount |
|---|---|---|---|
| Open | Hatcher Tinea | $171,780 | |
| Closed | Hatcher Tinea | $171,780 | |
| Previous Owner | Siebold David S | $148,096 |
Source: Public Records
Tax History Compared to Growth
Tax History
| Year | Tax Paid | Tax Assessment Tax Assessment Total Assessment is a certain percentage of the fair market value that is determined by local assessors to be the total taxable value of land and additions on the property. | Land | Improvement |
|---|---|---|---|---|
| 2025 | $2,124 | $318,840 | $70,000 | $248,840 |
| 2024 | $2,124 | $314,390 | $70,000 | $244,390 |
| 2023 | $1,686 | $314,390 | $70,000 | $244,390 |
| 2022 | $1,686 | $206,910 | $50,000 | $156,910 |
| 2021 | $1,686 | $206,910 | $50,000 | $156,910 |
| 2020 | $1,603 | $206,910 | $50,000 | $156,910 |
| 2019 | $1,588 | $51,320 | $50,000 | $1,320 |
| 2018 | $1,311 | $21,590 | $20,000 | $1,590 |
| 2017 | $1,311 | $21,590 | $20,000 | $1,590 |
| 2016 | $1,241 | $21,590 | $20,000 | $1,590 |
| 2015 | $1,186 | $170,670 | $20,000 | $150,670 |
| 2014 | $1,142 | $175,369 | $30,000 | $145,369 |
Source: Public Records
Map
Nearby Homes
- 187 Emberwood Dr
- 222 Bimini Dr
- 134 Jansen Ln
- Cypress Plan at Mallory Creek - Townhomes at Mallory Creek
- 130 Jansen Ln
- 136 N Palm Dr
- 106 Kellerton Ct
- 6441 Saxon Meadow Dr
- 2197 N Palm Dr
- 3057 Smeades Dr
- 115 Cove Landing
- 123 Cove Landing
- 1187 S Brook Rd
- 3045 Smeades Dr
- 199 Tylers Cove Way
- 368 St Kitts Way
- 376 St Kitts Way
- 3378 Hemlock Way
- 6097 Shore Park Dr
- 195 N Palm Dr